
You should consider the Fund’s investment objectives, risks, and charges and expenses carefully before you invest. The Prospectus details the Fund’s objective and policies and other matters of interest to the prospective investor. Please read the Prospectus carefully before investing. The Prospectus may be obtained by visiting the website at fpa.com, by calling toll-free, 1-800-982-4372, or by contacting the Fund in writing.
Average Annual Total Returns (%)
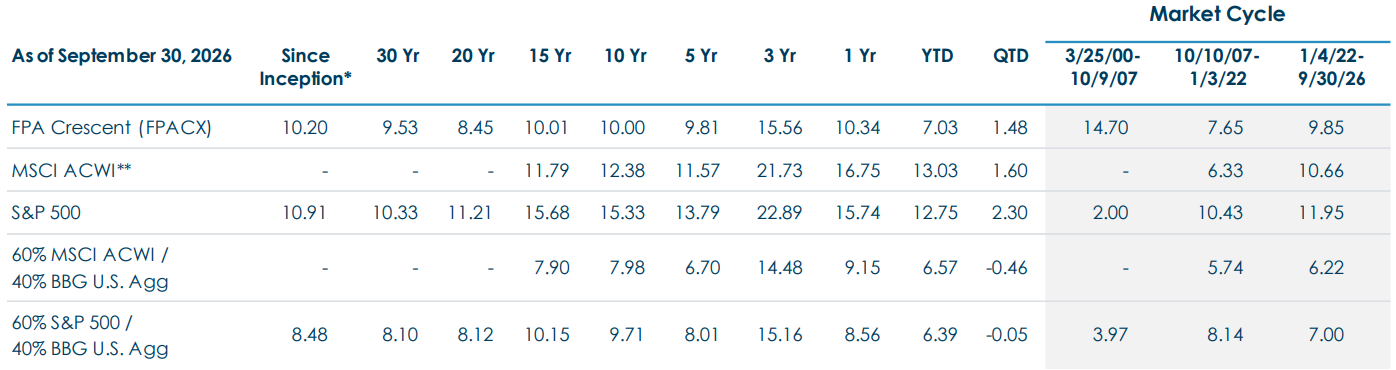
Index data source: Morningstar
Past performance is no guarantee of future results and current performance may be higher or lower than the performance shown. This data represents past performance and investors should understand that investment returns and principal values fluctuate, so that when you redeem your investment it may be worth more or less than its original cost. Current month-end performance data, which may be lower or higher than the performance data quoted, may be obtained at fpa.com or by calling toll-free, 1-800-982-4372. The FPA Crescent Fund – Institutional Class (“Fund” or “FPACX”) total expense ratio as of most recent prospectus is 1.09% and net expense ratio is 1.05% (including dividend and interest expense on short sales).
Periods greater than one year are annualized. Fund performance is shown net of all fees and expenses. Fund performance is calculated on a total return basis which includes reinvestment of all distributions. Fund returns do not reflect the deduction of taxes that a shareholder would pay on Fund distributions or the redemption of Fund shares, which would lower these figures. Comparison to any index is for illustrative purposes only. An investor cannot invest directly in an index. The Fund does not include outperformance of any index or benchmark in its investment objectives.
* The Fund commenced operations on June 2, 1993. The performance shown for periods prior to March 1, 1996 reflects the historical performance of a predecessor fund. FPA assumed control of the predecessor fund on March 1, 1996. The Fund’s objectives, policies, guidelines, and restrictions are, in all material respects, equivalent to those of the predecessor fund.
** The MSCI ACWI was not considered a relevant illustrative index prior to 2011 because the Fund was not classified as having global mandate until this point in time. Market Cycle Performance for MSCI ACWI is shown for illustrative purposes only in the most recently completed market cycle (i.e., 10/10/07-01/03/22) to illustrate how global equities performed during that period.
Market Cycle Performance reflects the two most recent completed market cycles (peak to peak) defined as a period that contains a decline of at least 20% from the previous market peak over at least a two-month period and a rebound to establish a new peak above the previous one by S&P 500 Index. It also includes the current cycle, which is ongoing and thus presented through the most recent quarter-end. Once the current cycle closes, the results presented may differ materially and may reflect a different time period than shown here.
First Pacific Advisors, LP (the “Adviser” or “FPA”), the Fund’s investment adviser, has contractually agreed to reimburse the Fund for operating expenses in excess of 0.05% of the average net assets of the Fund, excluding management fees, administrative service fees, short sale dividend expenses and interest expenses on cash deposits relating to short sales, brokerage fees and commissions, redemption liquidity service expenses, interest, taxes, fees and expenses of other funds in which the Fund invests, and extraordinary expenses, including litigation expenses not incurred in the Fund’s ordinary course of business, through January 8, 2028. The Adviser has also contractually agreed to reimburse the Fund for redemption liquidity service expenses in excess of 0.0044% of the average net assets of the Fund through January 8, 2028. These agreements may only be terminated earlier by the Fund’s Board of Trustees (the “Board”) or upon termination of the investment advisory agreement. Note that the management fees include both an advisory fee of 0.93% and class-specific administrative service fee of 0.07%. For additional information about the administrative service fee, please see the section in the prospectus titled “Management of the Fund.”
All data herein is representative of the Institutional Share Class. Please see important disclosures at the end of this commentary.
Dear Shareholder:
Performance Overview
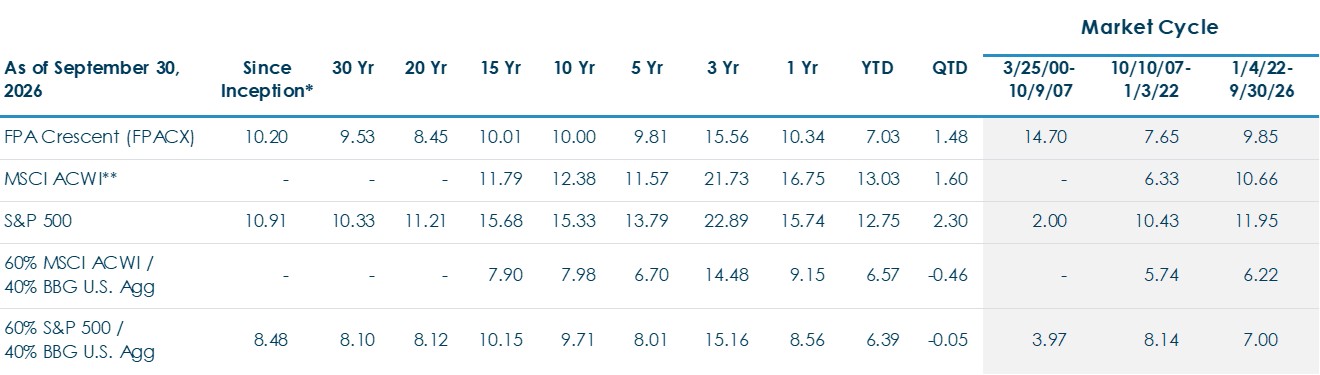
The FPA Crescent Fund – Institutional Class (“Fund” or “Crescent”) gained 1.48% for the quarter and 10.34% in the trailing twelve months
It captured 61.7% of the global market’s return (i.e., MSCI ACWI, the “ACWI”) over the trailing twelve months, slightly underperforming its own 64.0% average net risk exposure during the same period.
Performance versus Illustrative Indices (%)1
Past performance is no guarantee, nor is it indicative, of future results.
Portfolio & Market Discussion
Semiconductors and tech hardware now represent nearly 30% of the market, the highest level recorded.
Performance Overview
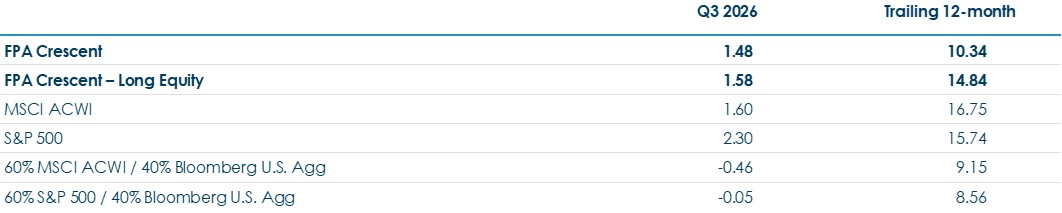
The FPA Crescent Fund – Institutional Class (“Fund” or “Crescent”) gained 1.48% for the quarter and 10.34% in the trailing twelve months. It captured 61.7% of the global market’s return (i.e., MSCI ACWI, the “ACWI”) over the trailing twelve months, slightly underperforming its own 64.0% average net risk exposure during the same period.
Performance versus Illustrative Indices (%)1
Past performance is no guarantee, nor is it indicative, of future results.
Activity in the third quarter was largely a continuation of the events discussed in the first half commentary. In addition to trimming back on positions which have benefited from being associated with the AI ecosystem, we have added new names in healthcare (i.e. Boston Scientific, HCA) as well as SMIDs both domestic and abroad (i.e. Core & Main, Fluidra, JBT Marel).
Turning to our cash position, a rising rate environment has offered the opportunity to buy short-term treasuries with yields close to 5% if one takes some liberties with rounding. In addition to availing itself of such opportunities, the Fund has also initiated a position in Treasury Inflation Protected Securities (TIPS), with real yields north of 3%.
Moving to corporates, spreads remain relatively tight versus treasuries, however, given the speed at which rates have recently risen, we would be surprised if this does not cause stress somewhere in the credit market. Rest assured, consistent with prior behavior, we will run our ruler over such opportunities if they present themselves.
As always, we remain patient but prepared to act when opportunities present themselves. We are currently building positions in several new investments that we believe offer attractive long-term return potential at sensible valuations, and we look forward to sharing more in our year-end letter.
Respectfully submitted,
FPA Crescent Portfolio Managers
October 9, 2026
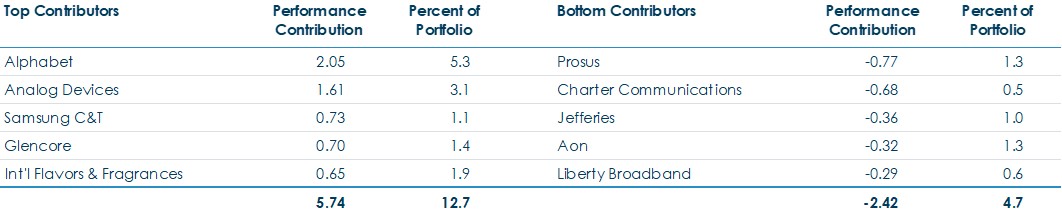
Crescent’s top five performers contributed 5.74% to its trailing twelve-month return while its bottom five contributed -2.42%.
Trailing Twelve-Month Top and Bottom Contributors (%) as of September 30, 20262
Past performance is no guarantee, nor is it indicative, of future results.
The following companies impacted portfolio performance but have not been recently discussed.3
Alphabet benefited from continued strength across its core businesses and increasing investor confidence in its positioning in AI. Search remained resilient despite concerns that generative AI could disrupt traditional search behavior, while Google Cloud continued to benefit from growing demand for AI infrastructure. The company has continued to integrate AI functionality throughout its products, while its collection of other assets, including YouTube and Waymo, provides additional sources of long-term value.
Analog Devices, a leading supplier of analog and mixed-signal semiconductors, continued to benefit from strong demand tied to AI infrastructure, industrial applications, and communications. During the quarter, ADI reported a record $4.0bn of revenue, with year-over-year growth led by its data center and industrial businesses, while management noted strengthening demand across its portfolio and provided a strong revenue outlook for the following quarter. ADI’s broad end-market exposure, coupled with increasing semiconductor content associated with AI infrastructure, has helped accelerate growth as the broader analog semiconductor cycle has recovered.
Samsung C&T benefited from improving investor recognition of the value embedded in its portfolio of strategic holdings, including its exposure to the broader Samsung ecosystem, alongside improving results in its operating businesses. Its construction business benefited from demand for high-tech facilities, while the company also maintains exposure to biotechnology, energy and other businesses. The shares appreciated despite volatility during the period as investors increasingly focused on the company’s underlying asset value and opportunities across its collection of businesses.
Although Prosus’ operating results continued to improve, including greater profitability across its e-commerce businesses and improving cash generation, the shares declined as investors weighed execution risk associated with the company’s acquisitions and investments. Prosus also continued its open-ended share repurchase program, which is supported in part through sales of Tencent shares and has historically been attractive given the discount between Prosus’ share price and its underlying net asset value.
Charter Communications and Liberty Broadband detracted from performance amid continued competitive pressure within the U.S. broadband market. Charter has faced competition from fiber overbuilders and fixed wireless offerings, while elevated capital expenditures and financial leverage have contributed to volatility in its shares. During the quarter, Charter completed its acquisition of Liberty Broadband and Cox Communications, improving the company’s balance sheet and expanding geographic coverage. We continue to view Charter’s combination of fixed broadband and mobile connectivity as an important competitive offering as the company works through the industry’s changing competitive environment.
Jefferies Financial Group detracted from performance despite continued momentum in its core investment banking and capital markets businesses. The company reported record quarterly investment banking and equities net revenues during the quarter. However, these results were partially offset by a more subdued environment in fixed income and challenges within portions of its asset management business. We continue to view Jefferies as an owner-oriented financial services business, with meaningful management ownership and a history of growing tangible book value while monetizing its merchant banking investments.
1 FPA, Morningstar. Comparison to the indices is for illustrative purposes only. The Fund does not include outperformance of any index or benchmark in its investment objectives. An investor cannot invest directly in an index. The long equity segment of the Fund is presented gross of investment management fees, transactions costs, and Fund operating expenses, which if included, would reduce the returns presented. Long equity holdings only includes equity securities excluding paired trades, short-sales, and preferred securities. The long equity performance information shown herein is for illustrative purposes only and may not reflect the impact of material economic or market factors. No representation is being made that any account, product, or strategy will or is likely to achieve profits, losses, or results similar to those shown. Long equity performance does not represent the return an investor in the Fund can or should expect to receive. Fund shareholders may only invest or redeem their shares at net asset value. Past performance is no guarantee, nor is it indicative, of future results.
2 Reflects the top five contributors and detractors to the Fund’s performance based on contribution to return for the trailing twelve months (“TTM”). Contribution is presented gross of investment management fees, transactions costs, and Fund operating expenses, which if included, would reduce the returns presented. Percent of portfolio reflects the average position size over the period. The information provided does not reflect all positions purchased, sold or recommended by FPA during the quarter. A copy of the methodology used and a list of every holding’s contribution to the overall Fund’s performance during the TTM is available by contacting FPA Client Service at [email protected]. It should not be assumed that recommendations made in the future will be profitable or will equal the performance of the securities listed. Past performance is no guarantee, nor is it indicative, of future results.
3 Historical commentaries for the Fund can be accessed on the fpa.com website.
FPA Crescent Fund Portfolio Highlights
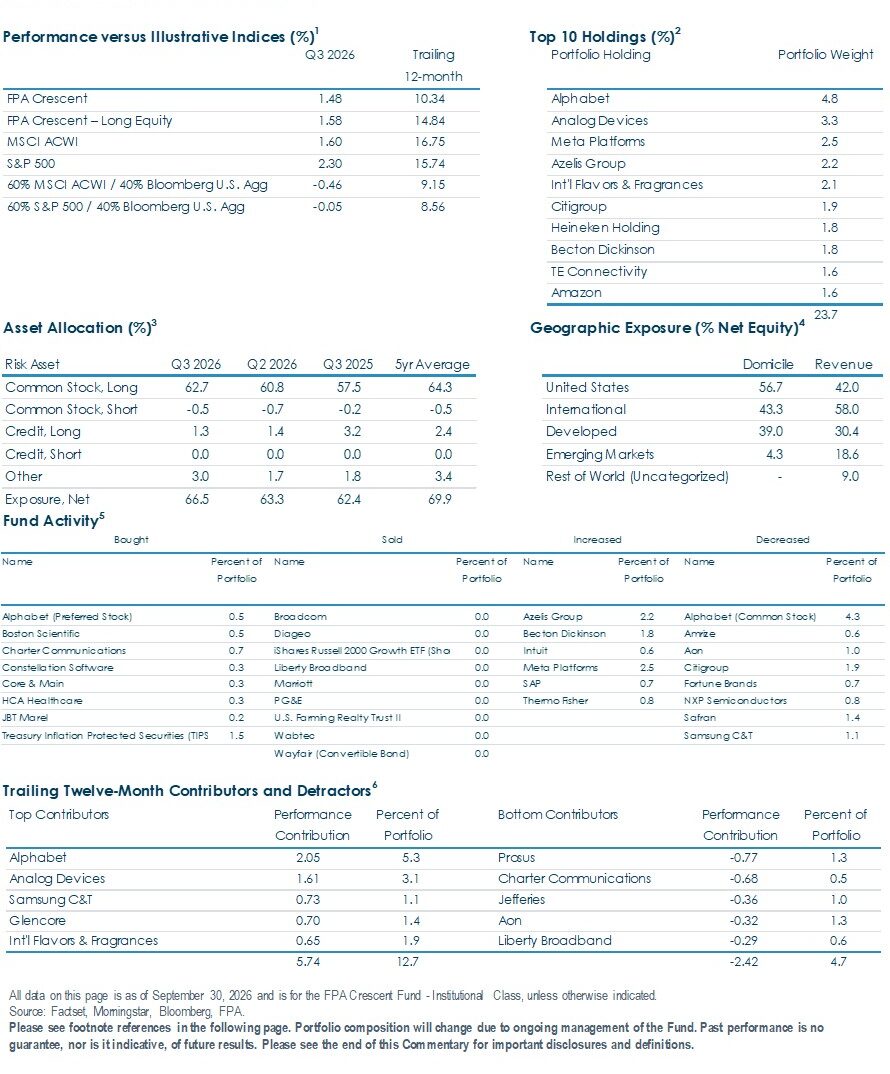
FPA Crescent Fund Portfolio Highlights Footnotes
1 Comparison to the indices is for illustrative purposes only. The Fund does not include outperformance of any index or benchmark in its investment objectives. An investor cannot invest directly in an index. The long equity segment of the Fund is presented gross of investment management fees, transactions costs, and Fund operating expenses, which if included, would reduce the returns presented. Crescent long equity excludes pair trades, short-sales, and preferred securities. The long equity performance information shown herein is for illustrative purposes only and may not reflect the impact of material economic or market factors. No representation is being made that any account, product or strategy will or is likely to achieve profits, losses, or results similar to those shown. Long equity performance does not represent the return an investor in the Fund can or should expect to receive. Fund shareholders may only invest or redeem their shares at net asset value.
2 List provides the top 10 holdings for the Fund as a percentage of total net assets.
3 Risk Assets include all investments excluding cash and cash equivalents. Net Risk Exposure is the percentage of portfolio exposed to Risk Assets. “Other” includes derivatives, futures, limited partnerships, and US Treasuries with maturity greater than 1 year.
4 Geographic exposure based on country of domicile and revenue by geography. Revenue refers to the geographic location of companies’ revenue sources, rather than where they are domiciled, and may provide insight into the portfolio’s geographic diversification. Domicile and revenue composition are shown for the FPA Crescent Fund – Institutional Class’s (“Fund”) net equity positions as of June 30, 2026. Portfolio composition will change due to ongoing management of the Fund. Excludes cash and cash equivalents.
5 The information provided does not reflect all positions purchased, sold or recommended by FPA during the quarter. The Bought/Sold table excludes positions used for cash management and positions that have not been explicitly identified in the fund’s most recent quarterly portfolio holdings report. It should not be assumed that an investment in the securities listed was or will be profitable. Increases and decreases represent securities whose position size either changed by at least 33% over the period and that represented greater than 0.75% of the portfolio at the beginning of the quarter or approximately greater than 0.25% of average NAV spent on trading. Percent of portfolio reflects the ending position size of the period. The portfolio holdings as of the most recent quarter-end may be obtained at fpa.com.
6 Reflects the top five contributors and detractors to the Fund’s performance based on contribution to return for the trailing twelve months (“TTM”). Contribution is presented gross of investment management fees, transactions costs, and Fund operating expenses, which if included, would reduce the returns presented. Percent of portfolio reflects the average position size over the period. The information provided does not reflect all positions purchased, sold or recommended by FPA during the quarter. A copy of the methodology used and a list of every holding’s contribution to the overall Fund’s performance during the TTM is available by contacting FPA Client Service at [email protected]. It should not be assumed that recommendations made in the future will be profitable or will equal the performance of the securities listed.
Important Information
This Commentary is for informational and discussion purposes only and does not constitute, and should not be construed as, an offer or solicitation for the purchase or sale with respect to any securities, products or services discussed, and neither does it provide investment advice. Any such offer or solicitation shall only be made pursuant to the Fund’s Prospectus, which supersedes the information contained herein in its entirety. This presentation does not constitute an investment management agreement or offering circular.
Any views expressed herein and any forward-looking statements are as of the date of the publication, are those of the portfolio management team, and are subject to change without notice. Future events or results may vary significantly from those expressed and are subject to change at any time in response to changing circumstances and industry developments. This information and data have been prepared from sources believed reliable, but the accuracy and completeness of the information cannot be guaranteed and is not a complete summary or statement of all available data. All information and data is as of the date of this commentary unless otherwise disclosed.
Portfolio composition will change due to ongoing management of the Fund. References to individual securities or sectors are for informational purposes only and should not be construed as recommendations by the Fund, the portfolio managers, the Adviser, or the distributor. It should not be assumed that future investments will be profitable or will equal the performance of the security or sector examples discussed. The portfolio holdings as of the most recent quarter-end may be obtained at fpa.com.
Investments carry risks and investors may lose principal value. Capital markets are volatile and can decline significantly in response to adverse issuer, political, regulatory, market, or economic developments. The Fund may purchase foreign securities, including American Depository Receipts (ADRs) and other depository receipts, which are subject to interest rate, currency exchange rate, economic and political risks; these risks may be heightened when investing in emerging markets. Foreign investments, especially those of companies in emerging markets, can be riskier, less liquid, harder to value, and more volatile than investments in the United States. Adverse political and economic developments or changes in the value of foreign currency can make it more difficult for the Fund to value the securities. Differences in tax and accounting standards, difficulties in obtaining information about foreign companies, restrictions on receiving investment proceeds from a foreign country, confiscatory foreign tax laws, and potential difficulties in enforcing contractual obligations, can all add to the risk and volatility of foreign investments.
Small and mid-cap stocks involve greater risks and may fluctuate in price more than larger company stocks. Short-selling involves increased risks and transaction costs. You risk paying more for a security than you received from its sale.
The return of principal in a bond investment is not guaranteed. Bonds have issuer, interest rate, inflation and credit risks. Interest rate risk is the risk that when interest rates go up, the value of fixed income securities, such as bonds, typically go down and investors may lose principal value. Credit risk is the risk of loss of principal due to the issuer’s failure to repay a loan. Generally, the lower the quality rating of a security, the greater the risk that the issuer will fail to pay interest fully and return principal in a timely manner. If an issuer defaults the security may lose some or all of its value. Lower rated bonds, callable bonds and other types of debt obligations involve greater risks. Mortgage-backed securities and asset-backed securities are subject to prepayment risk and the risk of default on the underlying mortgages or other assets. High yield securities can be volatile and subject to much higher instances of default. Derivatives may increase volatility.
The ratings agencies that provide ratings are Standard and Poor’s, Moody’s, Fitch, DBRS, Kroll, and any other nationally recognized statistical rating organization (“NRSRO”). Credit ratings range from AAA (highest) to D (lowest). Bonds rated BBB or above are considered investment grade. Credit ratings BB and below are lower-rated securities (junk bonds). High-yielding, non-investment grade bonds (junk bonds) involve higher risks than investment grade bonds. Bonds with credit ratings of CCC or below have high default risk.
Value securities, including those selected by the Fund’s portfolio managers, are subject to the risk that their intrinsic value may never be realized by the market because the market fails to recognize what the portfolio managers consider to be their true business value or because the portfolio managers have misjudged those values. In addition, value style investing may fall out of favor and underperform growth or other styles of investing during given periods.
While transactions in derivatives may reduce certain risks, they entail certain other risks. Derivatives may magnify the Fund’s gains or losses, causing it to make or lose substantially more than it invested. Derivatives have a risk of default by the counterparty to a contract. When used for hedging purposes, increases in the value of the securities the Fund holds or intends to acquire should offset any losses incurred with a derivative.
Investments in private securities and limited partnerships present risks. These investments are not registered under the federal securities laws and are generally eligible for sale only to certain eligible investors. They may be illiquid, and thus more difficult to sell, because there may be relatively few potential purchasers for such investments, and the sale of such investments may also be restricted under securities laws.
Please refer to the Fund’s Prospectus for a complete overview of the primary risks associated with the Fund.
In making any investment decision, you must rely on your own examination of the Fund, including the risks involved in an investment. Investments mentioned herein may not be suitable for all recipients and in each case, potential investors are advised not to make any investment decision unless they have taken independent advice from an appropriately authorized advisor. An investment in any security mentioned herein does not guarantee a positive return as securities are subject to market risks, including the potential loss of principal. You should not construe the contents of this document as legal, tax, investment or other advice or recommendations.
Morningstar and Index Definitions
Comparison to any index is for illustrative purposes only and should not be relied upon as a fully accurate measure of comparison. The Fund may be less diversified than the indices noted herein, and may hold non-index securities or securities that are not comparable to those contained in an index. Indices will hold positions that are not within the Fund’s investment strategy. Indices are unmanaged and do not reflect any commissions, transaction costs, or fees and expenses which would be incurred by an investor purchasing the underlying securities and which would reduce the performance in an actual account. You cannot invest directly in an index. The Fund does not include outperformance of any index in its investment objectives.
60% MSCI ACWI/40% Bloomberg U.S. Aggregate Index is a hypothetical combination of unmanaged indices comprised of 60% MSCI ACWI and 40% Bloomberg U.S. Aggregate Bond Index.
60% S&P 500/40% Bloomberg U.S. Aggregate Index is a hypothetical combination of unmanaged indices comprised of 60% S&P 500 Index and 40% Bloomberg U.S. Aggregate Bond Index.
Bloomberg U.S. Aggregate Bond Index provides a measure of the performance of the US investment grade bonds market, which includes investment grade U.S. Government bonds, investment grade corporate bonds, mortgage pass-through securities and asset-backed securities that are publicly offered for sale in the United States. The securities in the Index must have at least 1-year remaining in maturity. In addition, the securities must be denominated in US dollars and must be fixed rate, nonconvertible, and taxable.
MSCI ACWI NR USD Index (MSCI ACWI) is an unmanaged free float-adjusted market capitalization weighted index that is designed to measure the equity market performance of developed and emerging markets. Net Return (NR) indicates that withholding taxes are applied to dividend reinvestments. MSCI uses the withholding tax rate applicable to non-resident institutional investors that do not benefit from double taxation treaties.
Standard & Poor’s 500 Stock Index (S&P 500) is a capitalization-weighted index which covers industrial, utility, transportation and financial service companies, and represents approximately 75% of the New York Stock Exchange (NYSE) capitalization and 30% of NYSE issues. The S&P 500 is considered a measure of large capitalization stock performance.
Morningstar Global Moderate Allocation portfolios seek to provide both income and capital appreciation by investing in a mix of stocks, bonds, and cash. These portfolios typically have a moderate equity exposure, usually between 50% and 70%, with the remainder allocated to fixed income and cash. The Global component indicates that these funds may invest in a broad range of markets, including developed and emerging markets.
Glossary of Terms
Average Net Risk exposure is calculated as a simple average of the portfolio’s Net Risk Exposure as measured at the end of each quarter.
Equity-like returns refer to long-term returns that are comparable to those generated by equity markets.
Forward Price to Earnings is a version of the ratio of price-to-earnings (P/E) that uses forecasted earnings for the P/E calculation.
Trailing Twelve-Month Price to Earnings is based on the last 12 months of actual earnings.
Long Equity Performance represents the performance of stocks that the Fund owned over the given time periods and excludes the long equity portion of a pair trade, short-sales, limited partnerships, derivatives/futures, corporate bonds, mortgage-backed securities, and cash and cash equivalents.
Market Capitalization refers to the total dollar market value of a company’s outstanding shares of stock. Commonly referred to as “market cap,” it is calculated by multiplying the total number of a company’s outstanding shares by the current market price of one share.
Market Cycles, also known as stock market cycles, is a wide term referring to trends or patterns that emerge during different markets or business environments.
Net Equity Exposure includes long equity securities minus short-sales and preferred securities.
Net Risk Exposure is defined as the percentage of portfolio exposed to Risk Assets. Risk Assets include all investments excluding cash and cash equivalents.
Price to Earnings Ratio (P/E) is the price of a stock divided by its earnings per share. P/E is using weighted harmonic averaging, which helps avoid extreme results that may occur due to small relative numbers, and excludes Real Estate Investment Trusts (REITS).
Risk Assets generally refers to assets that have a significant degree of price volatility, such as equities, commodities, high-yield bonds, real estate and currencies, but does not include cash and cash equivalents.
Standard Deviation is a measure of dispersion of returns relative to its mean and is calculated as the square root of the variance. Higher deviation represents higher volatility.
Volatility is a statistical measure of the dispersion of returns for a given security or market index. In most cases, the higher the volatility, the riskier the security. Volatility is often measured as either the standard deviation or variance between returns from that same security or market index.
©2026 Morningstar, Inc. All Rights Reserved. The information contained herein: (1) is proprietary to Morningstar and/or its content providers; (2) may not be copied or distributed; and (3) is not warranted by Morningstar to be accurate, complete, or timely. Neither Morningstar nor its content providers are responsible for any damages or losses arising from any use of this information. Past performance is no guarantee of future results.
The FPA Funds are distributed by Distribution Services, LLC. Distribution Services, LLC and FPA are not affiliated.