
You should consider the Fund’s investment objectives, risks, and charges and expenses carefully before you invest. The Prospectus details the Fund’s objective and policies and other matters of interest to the prospective investor. Please read the Prospectus carefully before investing. The Prospectus may be obtained by visiting the website at fpa.com, by calling toll-free, 1-800-982-4372, or by contacting the Fund in writing.
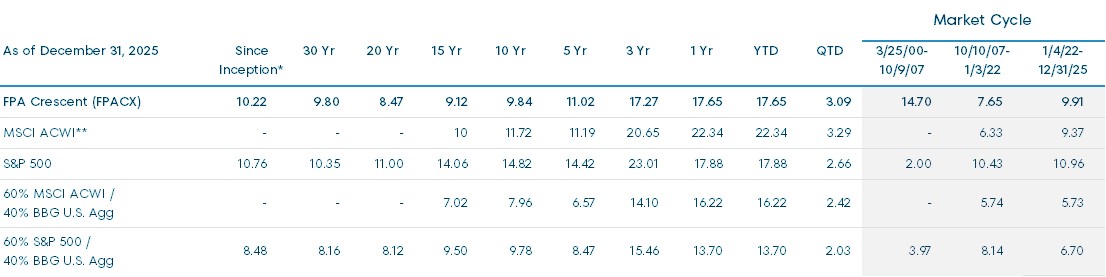
Average Annual Total Returns (%)
Index data source: Morningstar.
Past performance is no guarantee of future results and current performance may be higher or lower than the performance shown. This data represents past performance and investors should understand that investment returns and principal values fluctuate, so that when you redeem your investment it may be worth more or less than its original cost. Current month-end performance data, which may be lower or higher than the performance data quoted, may be obtained at fpa.com or by calling toll-free, 1- 800-982-4372. The FPA Crescent Fund – Institutional Class (“Fund” or “FPACX”) total expense ratio as of most recent prospectus is 1.06%, net expense ratio is 1.06% (including dividend and interest expense on short sales), and adjusted expense ratio is 1.05% (after reimbursement and excluding dividend and interest expense on short sales).
Periods greater than one year are annualized. Fund performance is shown net of all fees and expenses. Fund performance is calculated on a total return basis which includes reinvestment of all distributions. Fund returns do not reflect the deduction of taxes that a shareholder would pay on Fund distributions or the redemption of Fund shares, which would lower these figures. Comparison to any index is for illustrative purposes only. An investor cannot invest directly in an index. The Fund does not include outperformance of any index or benchmark in its investment objectives.
* The Fund commenced operations on June 2, 1993. The performance shown for periods prior to March 1, 1996 reflects the historical performance of a predecessor fund. FPA assumed control of the predecessor fund on March 1, 1996. The Fund’s objectives, policies, guidelines, and restrictions are, in all material respects, equivalent to those of the predecessor fund.
** The MSCI ACWI was not considered a relevant illustrative index prior to 2011 because the Fund was not classified as having global mandate until this point in time. Market Cycle Performance for MSCI ACWI is shown for illustrative purposes only in the most recently completed market cycle (i.e., 10/10/07-01/03/22) to illustrate how global equities performed during that period.
Market Cycle Performance reflects the two most recent completed market cycles (peak to peak) defined as a period that contains a decline of at least 20% from the previous market peak over at least a two-month period and a rebound to establish a new peak above the previous one by S&P 500 Index. It also includes the current cycle, which is ongoing and thus presented through the most recent quarter-end. Once the current cycle closes, the results presented may differ materially and may reflect a different time period than shown here.
First Pacific Advisors, LP (the “Adviser” or “FPA”), the Fund’s investment adviser, has contractually agreed to reimburse the Fund for operating expenses in excess of 0.05% of the average net assets of the Fund, excluding management fees, administrative service fees, short sale dividend expenses and interest expenses on cash deposits relating to short sales, brokerage fees and commissions, redemption liquidity service expenses, interest, taxes, fees and expenses of other funds in which the Fund invests, and extraordinary expenses, including litigation expenses not incurred in the Fund’s ordinary course of business, through April 30, 2026. The Adviser has also contractually agreed to reimburse the Fund for redemption liquidity service expenses in excess of 0.0044% of the average net assets of the Fund through April 30, 2026. These agreements may only be terminated earlier by the Fund’s Board of Trustees (the “Board”) or upon termination of the Advisory Agreement. Note that the management fees include both an advisory fee of 0.93% and class-specific administrative service fee of 0.07%. For additional information about the administrative service fee, please see the section in the Prospectus titled “Management of the Fund.”
All data herein is representative of the Institutional Share Class. Please see important disclosures at the end of this commentary.
Dear Shareholder:
Performance Overview
The FPA Crescent Fund – Institutional Class (“Fund” or “Crescent”) gained 3.09% for the quarter and 17.65% in 2025.
Its twelve-month return was 79.0% of the global market (i.e., MSCI AWCI, the “ACWI”), outperforming its 64.9% average net risk exposure during the same period.
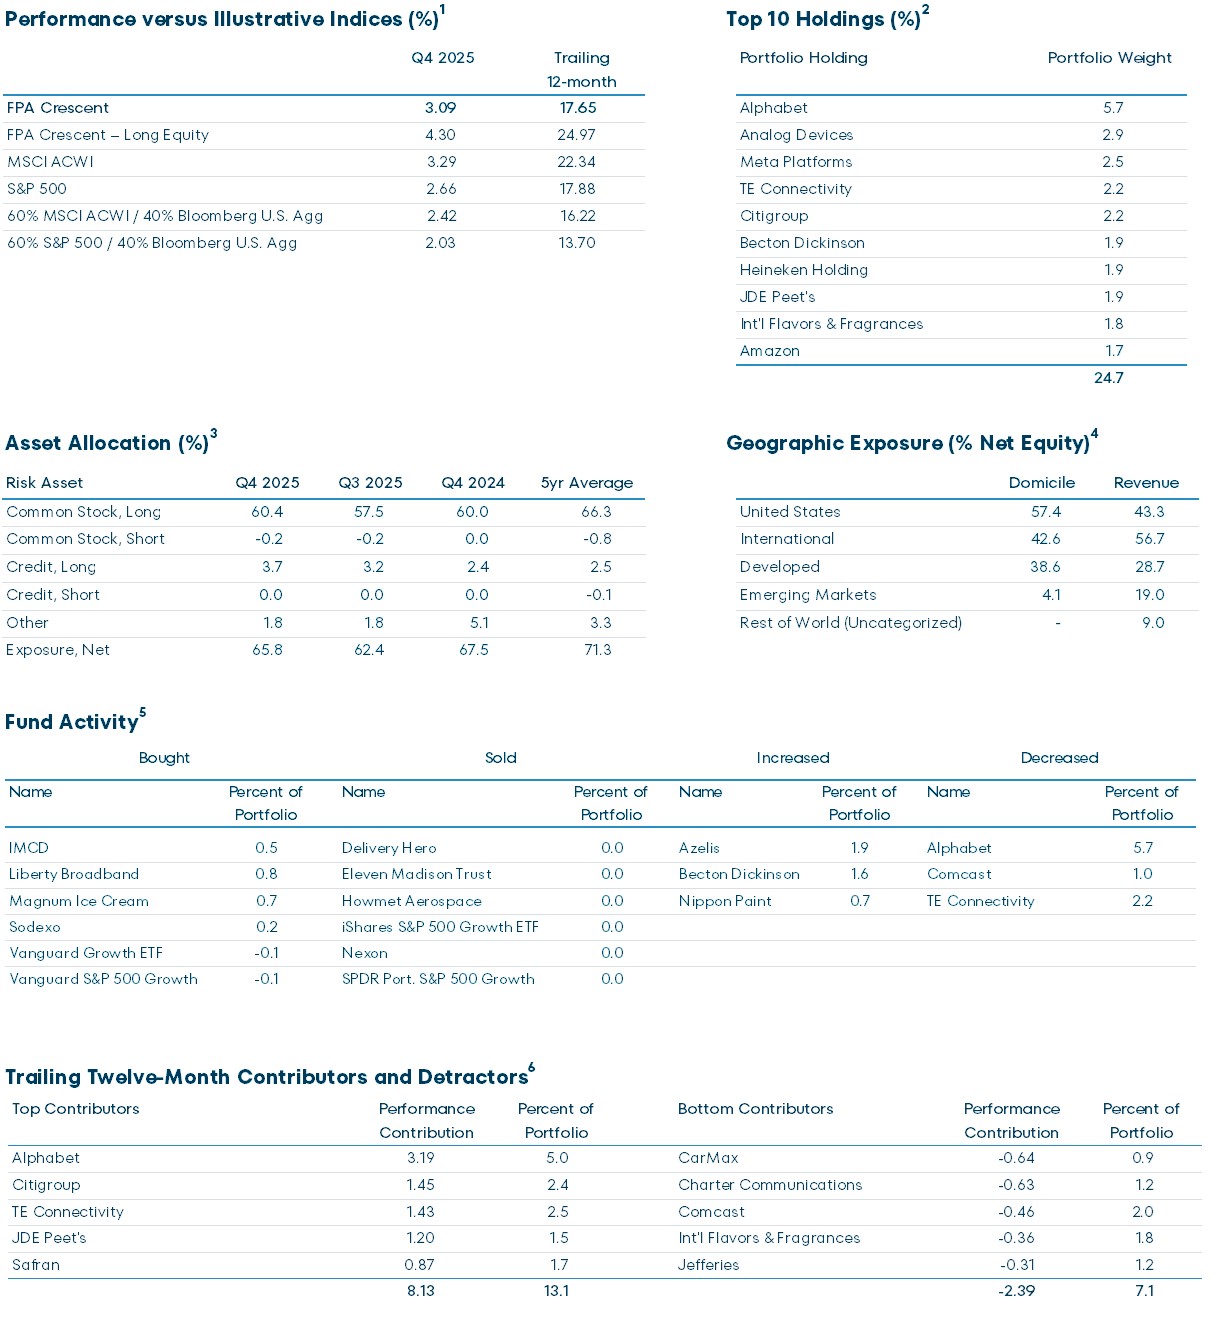
Performance versus Illustrative Indices (%)1
| Q4 2025 | Trailing 12-month | |
|---|---|---|
| FPA Crescent | 3.09 | 17.65 |
| FPA Crescent – Long Equity | 4.30 | 24.97 |
| MSCI ACWI | 3.29 | 22.34 |
| S&P 500 | 2.66 | 17.88 |
| 60% MSCI ACWI / 40% Bloomberg U.S. Agg | 2.42 | 16.22 |
| 60% S&P 500 / 40% Bloomberg U.S. Agg | 2.03 | 13.70 |
1 Source: FPA, Morningstar. Comparison to the indices is for illustrative purposes only. The Fund does not include outperformance of any index or benchmark in its investment objectives. An investor cannot invest directly in an index. The long equity segment of the Fund is presented gross of investment management fees, transactions costs, and Fund operating expenses, which if included, would reduce the returns presented. Long equity holdings only includes equity securities excluding paired trades, short-sales, and preferred securities. The long equity performance information shown herein is for illustrative purposes only and may not reflect the impact of material economic or market factors. No representation is being made that any account, product, or strategy will or is likely to achieve profits, losses, or results similar to those shown. Long equity performance does not represent the return an investor in the Fund can or should expect to receive. Fund shareholders may only invest or redeem their shares at net asset value.
Portfolio & Market Discussion
Crescent’s top five performers contributed 8.13% to its trailing twelve-month return while its bottom five detracted 2.39%.
Trailing Twelve-Month Top and Bottom Contributors (%) as of December 31, 20252
| Top Contributors | Performance Contribution | Percent of Portfolio | Bottom Contributors | Performance Contribution | Percent of Portfolio |
|---|---|---|---|---|---|
| Alphabet | 3.19 | 5.0 | CarMax | -0.64 | 0.9 |
| Citigroup | 1.45 | 2.4 | Charter Communications | -0.63 | 1.2 |
| TE Connectivity | 1.43 | 2.5 | Comcast | -0.46 | 2.0 |
| JDE Peet’s | 1.20 | 1.5 | Int’l Flavors & Fragrances | -0.36 | 1.8 |
| Safran | 0.87 | 1.7 | Jeffreries | -0.31 | 1.2 |
| 8.13 | 13.1 | -2.39 | 7.1 |
2 Reflects the top five contributors and detractors to the Fund’s performance based on contribution to return for the trailing twelve months (“TTM”). Contribution is presented gross of investment management fees, transactions costs, and Fund operating expenses, which if included, would reduce the returns presented. Percent of portfolio reflects the average position size over the period. The information provided does not reflect all positions purchased, sold or recommended by FPA during the quarter. A copy of the methodology used and a list of every holding’s contribution to the overall Fund’s performance during the TTM is available by contacting FPA Client Service at [email protected]. It should not be assumed that recommendations made in the future will be profitable or will equal the performance of the securities listed.
If you spend time in our office, you will inevitably overhear our FPA colleague Brian Selmo comment that “Securities ask different questions at different prices.” For securities trading at elevated multiples, the questions are likely to be difficult, if not impossible to answer, and possibly even multiplicative in nature. In other instances, for out of favor names, one is simply determining if the future could be better than the present, with conditions potentially turning positive as the cherry on top.
By focusing on the less challenging questions, we largely avoid the speculative areas of the market where we deem the reward for taking risks insufficient relative to the potential returns. This does not imply that we completely avoid mistakes, but we believe it helps limit the damage when we do err in judgement. Over the last 30 years, the end-product of this process has been a strategy that has generated equity-like returns while placing equal importance on both capital preservation and capital appreciation. Ultimately, this approach requires an unwavering commitment to being “value aware,” a philosophy that underpins our research process.
In doing so, we consider both quantitative and qualitative analysis as we underwrite potential new investments and monitor existing positions. It is not enough to be a great company, nor is it sufficient to simply trade on a superficially low p/e multiple to garner our interest and attention. Instead, we are looking for rare cases where both quality and “value” intersect, even if near-term headwinds may delay the potential payoff.
Hence, when it comes to deploying capital into new names, it is rare that you will find our recent purchases on the 52-week high list. Instead, we thumb our noses at the momentum factor and regularly troll the 52-week low list for potential opportunities. It is in that vein that we let value guide our focus. So, before you pose questions on our upcoming conference call, we don’t have any unique insight into American exceptionalism or whether we are in an AI bubble. Well, you can still ask, but we don’t think we know the answer.
However, we do believe that the investment community is currently casting its gaze away from various market constituents that offer asymmetric risk-reward for those willing to look forward three to five years. We primarily speak of small- to mid-cap global securities, and, up until recently, healthcare stocks. As you can see from the image below, new purchases over the past two years are clear evidence that we are willing to back up this view with our actions and not just our words.
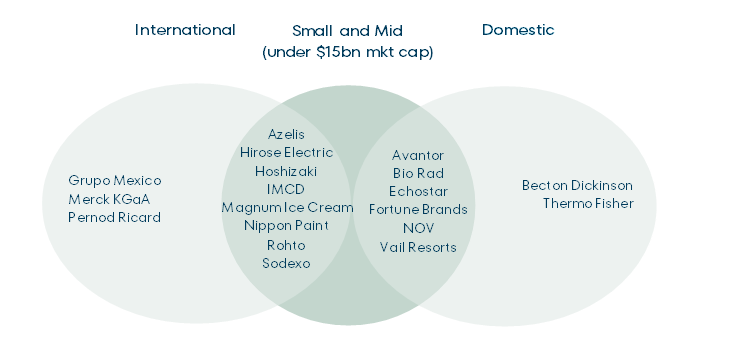
While few of the above are household names, we believe each holds a strong competitive position in their respective industry, if not market leadership. Furthermore, we would go so far as to say we believe we purchased them at absolute values that we believe will help us achieve equity-like returns over the coming years, and at bargain-like valuations compared to the S&P 500.
As for the why, we know not the answer, but we have our suspicions. With the recent outperformance of large US technology companies, not to mention the adoption of passive investing, there may be a shrinking pool of active investors with the interest, resources, and capital to conduct in-depth research on 1) smid-cap names, and 2) ideas that necessitate deferred gratification longer than one to two quarters. And as it relates to the active investors hoovering up assets, in our experience it is rare to find a pod shop on the share registers of, say, Azelis, Nippon Paint, Sodexo, or NOV.
Lastly, there’s a good reason why the commentary above does not necessarily jive with all of our holdings, say such as our top four holdings by weight Alphabet (purchased 2010), Meta purchased (2018), Analog Devices (purchased 2011), and TE Connectivity (purchased 2012). We use these names to remind you that our average holding period is in excess of five years, and for those in the top ten, demonstrably longer. We purchased each of the aforementioned “GARPY” names initially when they were making headlines for the wrong reasons, and we would argue their present standing does not betray our ethos as price-disciplined investors, but rather is indicative of our research process and strategy working as intended… sometimes the high case does actually play out!3
3 GARP = Growth At a Reasonable Price. Past performance is no guarantee of future results. It should not be assumed that an investment in the securities mentioned was or will be profitable. The Fund’s full list of holdings as of the most recent period can be found at https://fpa.com/fund/fpa-crescent-fund/#tab-fund-holdings. The information provided does not reflect all positions purchased, sold or recommended by FPA during the period.
Past performance is no guarantee, nor is it indicative, of future results.
Now, as an example of a tough question currently being posed by the market, we submit Microsoft, a company we actually owned from 2010 to 2020. To begin, we hold management in the highest regards, particularly the CEO and CFO, who created tremendous value for us during our ownership. When we originally purchased Microsoft back in 2010, the valuation was less than 10x after-tax earnings after subtracting the cash on the balance sheet. The question we had to ask at the time was whether Microsoft was a melting ice cube, or could the company deliver an equity-type rate of return even if earnings never grew again. To our regret, we sold Microsoft too early, failing to appreciate how technological developments, particularly those of AI/cloud, would transform the business.
In the five years following our sale, from 2020 through 2025, Microsoft grew its top line at a 12% compound annual growth rate (“CAGR”), and its bottom line even faster! But let’s now look at what one must believe to be constructive on the return prospects at the current multiple of 30x+ earnings. Of course, 30x earnings on its own is not necessarily the wrong multiple if Microsoft can continue to grow at a double-digit rate over the coming five years, and market analysts have noted that the valuation looks inexpensive five years out even if revenue were only to grow at a more pedestrian CAGR of 10% during this period.
Stepping back, we will note that Microsoft generated $293bn of revenue over the last twelve months. If revenue were indeed to grow at 10% CAGR over the next five years, Microsoft would theoretically generate $472bn in revenue in 2030, an increase of $178bn. The bulls will say this is achievable based on growth in the core business and an expanding total available market (“TAM”). However, to put the $178bn increase into perspective, Microsoft would need to add revenue greater than the aggregate sales of ERP leaders Oracle and SAP, who generated ~$100bn in combined sales over the past twelve months. The bulls may say that our thinking is too narrow; vibe coding will also allow Microsoft to serve as the foundation or platform upon which corporations will create low-cost alternative solutions for CRM solutions (Salesforce: $40bn revenue), HR software (Workday: $9bn revenue), and new database products (Snowflake: $4.4bn revenue). Moreover, as the bulls believe, from a horizontal perspective, agentic AI will enable Microsoft to offer services to automate and manage digital workflows (ServiceNow: $12bn revenue) across industries. If that was not enough, the bulls will remind us that Microsoft has a consumer gaming franchise in Xbox that will grow over time (Nintendo: $12bn revenue).
To put the words into a picture, for Microsoft to grow at 10% over the next five years, one must believe the company will generate incremental revenue currently generated by the combination of:4
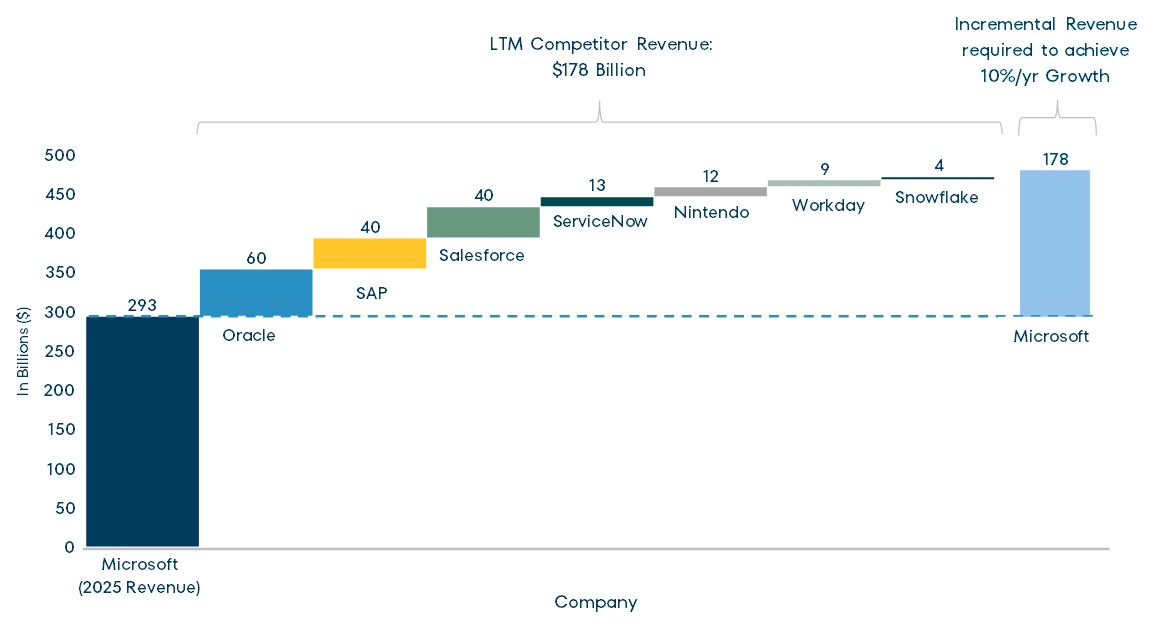
4 Forward looking. Refer to the Important Information and other disclosures at the back of this material.
We are not saying this can’t happen, but thankfully as benchmark agnostic investors, there is nothing forcing us to make the wager that it will. Speaking of wagers, we are regularly asked whether the higher-than-average multiples, particularly in US markets, make us inclined to believe a near-term market wobble lies around the corner. To that we emphatically answer “Yes” from our square offices, but with the caveat that we don’t know from which corner. And so rather than make top-down bets, we simply go about our business conducting bottoms-up fundamental analysis with the hope that it helps us find a handful of good ideas each year and keeps us away from the bad ones.
Speaking of bad, realized capital gains during 2025 were higher than we prefer, which resulted in a modest capital gain distribution in relation to the fund’s total return in December. The good news is that 100% of it was in the form of “long-term” capital gains, which are taxed at lower rates than “short-term” gains, and that we remain in the top 2% of our Morningstar category for after-tax returns over the past 5, 10 and 15 years.
With stand-alone ETFs (like the Fund’s sister ETF, FPA Global Equity – ticker: FPAG) typically making only de minimis capital gain distributions and ETF share classes on the near to mid-term horizon, we know the bar is higher now than even five years ago. So, in late Q4 we onboarded an additional portfolio rebalancing tool that can have a positive side effect of helping us meet our goals to reduce capital gain distributions.
In 2025, we were able to dispose of assets with ~$182 million of gain without making corresponding capital gain distributions using our legacy tools we onboarded in 2021. In just November and December alone, we were able to dispose of assets with over ~$315 million of gain without making corresponding capital gain distributions as a byproduct of our new tool. As they say: so far, so good. We think our current set of tools coupled with our generally low-turnover approach should support our goal of low-single digit capital gain distributions attributable to securities that could have been disposed of through in-kind redemptions.
With that said, it is important to note that even if the Fund converted to a stand-alone ETF tomorrow, it would still likely pay out capital gain distributions because Crescent often owns securities that cannot be disposed of through in-kind redemptions. These include private securities (like our recent shipping investments that have been a strong contributor over the past five years), derivatives (like our interest rate caps that performed well in 2022), high-yield bonds, some foreign equities, and the list goes on. To help shareholders get a better sense of how we are doing on our above goal, our future capital gain estimates will start to note what percentage of capital gains are from securities that can be disposed of through in-kind redemptions.
Closing
We appreciate the long-term partnership we’ve had with so many of our like-minded investors who maintain a similar “value aware” point of view and long holding period. To the old and the new, we seek to continually earn your trust through the inevitable market cycles for the capital you have entrusted to us.
Respectfully submitted,
FPA Crescent Portfolio Managers
January 29, 2025
FPA Crescent Fund Portfolio Highlights
All data on this page as of December 31, 2025 and is for the FPA Crescent Fund – Institutional Class, unless otherwise indicated.
Source: Factset, Morningstar, Bloomberg, FPA.
Please see footnote references in the following page. Portfolio composition will change due to ongoing management of the Fund. Past performance is no guarantee, nor is it indicative, of future results. Please see the end of this Commentary for important disclosures and definitions.
FPA Crescent Fund Portfolio Highlights Footnotes
1 Source: FPA, Morningstar. Comparison to the indices is for illustrative purposes only. The Fund does not include outperformance of any index or benchmark in its investment objectives. An investor cannot invest directly in an index. The long equity segment of the Fund is presented gross of investment management fees, transactions costs, and Fund operating expenses, which if included, would reduce the returns presented. Long equity holdings only includes equity securities excluding paired trades, short-sales, and preferred securities. The long equity performance information shown herein is for illustrative purposes only and may not reflect the impact of material economic or market factors. No representation is being made that any account, product, or strategy will or is likely to achieve profits, losses, or results similar to those shown. Long equity performance does not represent the return an investor in the Fund can or should expect to receive. Fund shareholders may only invest or redeem their shares at net asset value.
2 List provides the top 10 holdings for the Fund as a percentage of total net assets.
3 Risk Assets include all investments excluding cash and cash equivalents. Net Risk Exposure is the percentage of portfolio exposed to Risk Assets. “Other” includes derivatives, futures, limited partnerships, and US Treasuries with maturity greater than 1 year.
4 Geographic exposure based on country of domicile and revenue by geography. Revenue refers to the geographic location of companies’ revenue sources, rather than where they are domiciled, and may provide insight into the portfolio’s geographic diversification. Domicile and revenue composition are shown for the FPA Crescent Fund – Institutional Class’s (“Fund”) net equity positions as of June 30, 2025. Portfolio composition will change due to ongoing management of the Fund. Excludes cash and cash equivalents.
5 The information provided does not reflect all positions purchased, sold or recommended by FPA during the quarter. The Bought/Sold table excludes positions used for cash management and positions that have not been explicitly identified in the fund’s most recent quarterly portfolio holdings report. It should not be assumed that an investment in the securities listed was or will be profitable. Increases and decreases represent securities whose position size either changed by at least 33% over the period and that represented greater than 0.75% of the portfolio at the beginning of the quarter or approximately greater than 0.25% of average NAV spent on trading. Percent of portfolio reflects the ending position size of the period. The portfolio holdings as of the most recent quarter-end may be obtained at fpa.com.
6 Reflects the top five contributors and detractors to the Fund’s performance based on contribution to return for the trailing twelve months (“TTM”). Contribution is presented gross of investment management fees, transactions costs, and Fund operating expenses, which if included, would reduce the returns presented. Percent of portfolio reflects the average position size over the period. The information provided does not reflect all positions purchased, sold or recommended by FPA during the quarter. A copy of the methodology used and a list of every holding’s contribution to the overall Fund’s performance during the TTM is available by contacting FPA Client Service at [email protected]. It should not be assumed that recommendations made in the future will be profitable or will equal the performance of the securities listed.
Important Information
This Commentary is for informational and discussion purposes only and does not constitute, and should not be construed as, an offer or solicitation for the purchase or sale with respect to any securities, products or services discussed, and neither does it provide investment advice. Any such offer or solicitation shall only be made pursuant to the Fund’s Prospectus, which supersedes the information contained herein in its entirety. This presentation does not constitute an investment management agreement or offering circular.
Any views expressed herein and any forward-looking statements are as of the date of the publication, are those of the portfolio management team, and are subject to change without notice. Future events or results may vary significantly from those expressed and are subject to change at any time in response to changing circumstances and industry developments. This information and data have been prepared from sources believed reliable, but the accuracy and completeness of the information cannot be guaranteed and is not a complete summary or statement of all available data. All information and data is as of the date of this commentary unless otherwise disclosed.
Portfolio composition will change due to ongoing management of the Fund. References to individual securities or sectors are for informational purposes only and should not be construed as recommendations by the Fund, the portfolio managers, the Adviser, or the distributor. It should not be assumed that future investments will be profitable or will equal the performance of the security or sector examples discussed. The portfolio holdings as of the most recent quarter-end may be obtained at fpa.com.
Investments carry risks and investors may lose principal value. Capital markets are volatile and can decline significantly in response to adverse issuer, political, regulatory, market, or economic developments. The Fund may purchase foreign securities, including American Depository Receipts (ADRs) and other depository receipts, which are subject to interest rate, currency exchange rate, economic and political risks; these risks may be heightened when investing in emerging markets. Foreign investments, especially those of companies in emerging markets, can be riskier, less liquid, harder to value, and more volatile than investments in the United States. Adverse political and economic developments or changes in the value of foreign currency can make it more difficult for the Fund to value the securities. Differences in tax and accounting standards, difficulties in obtaining information about foreign companies, restrictions on receiving investment proceeds from a foreign country, confiscatory foreign tax laws, and potential difficulties in enforcing contractual obligations, can all add to the risk and volatility of foreign investments.
Small and mid-cap stocks involve greater risks and may fluctuate in price more than larger company stocks. Short-selling involves increased risks and transaction costs. You risk paying more for a security than you received from its sale.
The return of principal in a bond investment is not guaranteed. Bonds have issuer, interest rate, inflation and credit risks. Interest rate risk is the risk that when interest rates go up, the value of fixed income securities, such as bonds, typically go down and investors may lose principal value. Credit risk is the risk of loss of principal due to the issuer’s failure to repay a loan. Generally, the lower the quality rating of a security, the greater the risk that the issuer will fail to pay interest fully and return principal in a timely manner. If an issuer defaults the security may lose some or all of its value. Lower rated bonds, callable bonds and other types of debt obligations involve greater risks. Mortgage-backed securities and asset-backed securities are subject to prepayment risk and the risk of default on the underlying mortgages or other assets. High yield securities can be volatile and subject to much higher instances of default. Derivatives may increase volatility.
The ratings agencies that provide ratings are Standard and Poor’s, Moody’s, Fitch, DBRS, Kroll, and any other nationally recognized statistical rating organization (“NRSRO”). Credit ratings range from AAA (highest) to D (lowest). Bonds rated BBB or above are considered investment grade. Credit ratings BB and below are lower-rated securities (junk bonds). High-yielding, non-investment grade bonds (junk bonds) involve higher risks than investment grade bonds. Bonds with credit ratings of CCC or below have high default risk.
Value securities, including those selected by the Fund’s portfolio managers, are subject to the risk that their intrinsic value may never be realized by the market because the market fails to recognize what the portfolio managers consider to be their true business value or because the portfolio managers have misjudged those values. In addition, value style investing may fall out of favor and underperform growth or other styles of investing during given periods.
While transactions in derivatives may reduce certain risks, they entail certain other risks. Derivatives may magnify the Fund’s gains or losses, causing it to make or lose substantially more than it invested. Derivatives have a risk of default by the counterparty to a contract. When used for hedging purposes, increases in the value of the securities the Fund holds or intends to acquire should offset any losses incurred with a derivative.
Investments in private securities and limited partnerships present risks. These investments are not registered under the federal securities laws and are generally eligible for sale only to certain eligible investors. They may be illiquid, and thus more difficult to sell, because there may be relatively few potential purchasers for such investments, and the sale of such investments may also be restricted under securities laws.
Please refer to the Fund’s Prospectus for a complete overview of the primary risks associated with the Fund.
In making any investment decision, you must rely on your own examination of the Fund, including the risks involved in an investment. Investments mentioned herein may not be suitable for all recipients and in each case, potential investors are advised not to make any investment decision unless they have taken independent advice from an appropriately authorized advisor. An investment in any security mentioned herein does not guarantee a positive return as securities are subject to market risks, including the potential loss of principal. You should not construe the contents of this document as legal, tax, investment or other advice or recommendations.
Morningstar and Index Definitions
Comparison to any index is for illustrative purposes only and should not be relied upon as a fully accurate measure of comparison. The Fund may be less diversified than the indices noted herein, and may hold non-index securities or securities that are not comparable to those contained in an index. Indices will hold positions that are not within the Fund’s investment strategy. Indices are unmanaged and do not reflect any commissions, transaction costs, or fees and expenses which would be incurred by an investor purchasing the underlying securities and which would reduce the performance in an actual account. You cannot invest directly in an index. The Fund does not include outperformance of any index in its investment objectives.
60% MSCI ACWI/40% Bloomberg U.S. Aggregate Index is a hypothetical combination of unmanaged indices comprised of 60% MSCI ACWI and 40% Bloomberg U.S. Aggregate Bond Index.
60% S&P 500/40% Bloomberg U.S. Aggregate Index is a hypothetical combination of unmanaged indices comprised of 60% S&P 500 Index and 40% Bloomberg U.S. Aggregate Bond Index.
Bloomberg U.S. Aggregate Bond Index provides a measure of the performance of the US investment grade bonds market, which includes investment grade U.S. Government bonds, investment grade corporate bonds, mortgage pass-through securities and asset-backed securities that are publicly offered for sale in the United States. The securities in the Index must have at least 1-year remaining in maturity. In addition, the securities must be denominated in US dollars and must be fixed rate, nonconvertible, and taxable.
MSCI ACWI NR USD Index (MSCI ACWI) is an unmanaged free float-adjusted market capitalization weighted index that is designed to measure the equity market performance of developed and emerging markets. Net Return (NR) indicates that withholding taxes are applied to dividend reinvestments. MSCI uses the withholding tax rate applicable to non-resident institutional investors that do not benefit from double taxation treaties.
MSCI China Index captures large and mid-cap representation across China A shares, H shares, B shares, Red chips, P chips and foreign listings (e.g. ADRs).
MSCI Emerging Markets Index captures large and mid-cap representation across emerging markets countries. The index covers approximately 85% of the free float-adjusted market capitalization in each country. Net Return (NR) indicates that withholding taxes are applied to dividend reinvestments. MSCI uses withholding tax rates applicable to Luxembourg holding companies.
MSCI Europe Index captures large and mid-cap representation across Developed Markets (DM) countries in Europe. Developed Markets countries in Europe include: Austria, Belgium, Denmark, Finland, France, Germany, Ireland, Italy, the Netherlands, Norway, Portugal, Spain, Sweden, Switzerland and the UK.
MSCI Japan Index is designed to measure the performance of the large and mid-cap segments of the Japanese market.
Standard & Poor’s 500 Stock Index (S&P 500) is a capitalization-weighted index which covers industrial, utility, transportation and financial service companies, and represents approximately 75% of the New York Stock Exchange (NYSE) capitalization and 30% of NYSE issues. The S&P 500 is considered a measure of large capitalization stock performance.
Morningstar Global Moderate Allocation portfolios seek to provide both income and capital appreciation by investing in a mix of stocks, bonds, and cash. These portfolios typically have a moderate equity exposure, usually between 50% and 70%, with the remainder allocated to fixed income and cash. The Global component indicates that these funds may invest in a broad range of markets, including developed and emerging markets.
Glossary of Terms
Average Net Risk exposure is calculated as a simple average of the portfolio’s Net Risk Exposure as measured at the end of each quarter.
Compound annual growth rate (CAGR) is the annual rate of return that shows how an investment grows from its beginning value to its ending value over time, assuming reinvested profits.
Earnings Per Share (EPS) Average Net Risk exposure is calculated as a simple average of the portfolio’s Net Risk Exposure as measured at the end of each quarter.
Earnings Yield is the earnings per share for the most recent 12-month period divided by the current market price per share.
Forward Price to Earnings is a version of the ratio of price-to-earnings (P/E) that uses forecasted earnings for the P/E calculation.
Free Cash Flow represents the cash a company can generate after required investment to maintain or expand its asset base.
Long Equity Performance represents the performance of stocks that the Fund owned over the given time periods and excludes the long equity portion of a pair trade, short-sales, limited partnerships, derivatives/futures, corporate bonds, mortgage-backed securities, and cash and cash equivalents.
Market Capitalization refers to the total dollar market value of a company’s outstanding shares of stock. Commonly referred to as “market cap,” it is calculated by multiplying the total number of a company’s outstanding shares by the current market price of one share.
Market Cycles, also known as stock market cycles, is a wide term referring to trends or patterns that emerge during different markets or business environments.
Net Equity Exposure includes long equity securities minus short-sales and preferred securities.
Net Risk Exposure is defined as the percentage of portfolio exposed to Risk Assets. Risk Assets include all investments excluding cash and cash equivalents.
Price to Earnings Ratio (P/E) is the price of a stock divided by its earnings per share. P/E is using weighted harmonic averaging, which helps avoid extreme results that may occur due to small relative numbers, and excludes Real Estate Investment Trusts (REITS).
Return on Tangible Equity (ROTE) is a financial profitability metric that measures a company’s earnings as a percentage of its tangible shareholders’ equity.
Risk Assets generally refers to assets that have a significant degree of price volatility, such as equities, commodities, high-yield bonds, real estate and currencies, but does not include cash and cash equivalents.
Standard Deviation is a measure of dispersion of returns relative to its mean and is calculated as the square root of the variance. Higher deviation represents higher volatility.
Tangible Book Value is a company’s total book value minus its intangible assets like goodwill and patents. It provides a more conservative estimate of a company’s net worth by excluding non-physical assets that may have little to no liquidation value.
12-Month Trailing P/E is based on the last 12 months of actual earnings.
Volatility is a statistical measure of the dispersion of returns for a given security or market index. In most cases, the higher the volatility, the riskier the security. Volatility is often measured as either the standard deviation or variance between returns from that same security or market index.
©2026 Morningstar, Inc. All Rights Reserved. The information contained herein: (1) is proprietary to Morningstar and/or its content providers; (2) may not be copied or distributed; and (3) is not warranted by Morningstar to be accurate, complete, or timely. Neither Morningstar nor its content providers are responsible for any damages or losses arising from any use of this information. Past performance is no guarantee of future results.
The FPA Funds are distributed by Distribution Services, LLC, 190 Middle Street, Suite 301, Portland, ME 04101. Distribution Services, LLC and FPA are not affiliated.