
You should consider the Fund’s investment objectives, risks, and charges and expenses carefully before you invest. You can obtain additional information by visiting the website at https://fpa.com/fund/source-capital/, by email at [email protected], or toll-free by calling 1-800-279-1241.
Average Annual Total Returns (%)
| As of December 31, 2025 | Since 12/1/15* | 10 Yr | 5 Yr | 3 Yr | 1 Yr | YTD | QTD |
|---|---|---|---|---|---|---|---|
| Source Capital – NAV | 8.38 | 8.84 | 9.66 | 15.38 | 18.40 | 18.40 | 4.27 |
| Source Capital – Market Price | 9.59 | 10.10 | 11.49 | 14.88 | 11.33 | 11.33 | 3.01 |
| 60% MSCI ACWI / 40% BBG U.S. Agg | 7.76 | 7.96 | 6.57 | 14.10 | 16.22 | 16.22 | 2.42 |
| 60% S&P 500 / 40% BBG U.S. Agg | 9.58 | 9.78 | 8.47 | 15.46 | 13.70 | 13.70 | 2.03 |
Index data source: Morningstar.
Past performance is no guarantee of future results and current performance may be higher or lower than the performance shown. This data represents past performance and investors should understand that investment returns and principal values fluctuate, so that when you redeem your investment it may be worth more or less than its original cost. Current month-end performance data, which may be lower or higher than the performance data quoted, may be obtained at fpa.com or by calling toll-free, 1-800-982-4372.
Periods over one year are annualized. Fund performance is shown net of all fees and expenses and includes the reinvestment of distributions. Returns do not reflect the deduction of taxes that a shareholder would pay on Fund distributions, which would lower these figures. Since Source Capital is a closed-end investment company and its shares are bought and sold on the New York Stock Exchange, your performance may also vary based upon the market price of the common stock. Comparison to any index is for illustrative purposes only. An investor cannot invest directly in an index. The Fund does not include outperformance of any index or benchmark in its investment objectives.
* On December 1, 2015, the Fund transitioned to a balanced strategy and the current portfolio managers assumed management of the Fund on that date.
Please see important disclosures at the end of this commentary.
Dear Shareholder:
Performance Overview
Source Capital’s (“Source” or “Fund”) net asset value (NAV) gained 4.27% for the quarter and 18.40% for the trailing twelve months, which is higher than the balanced MSCI ACWI/Bloomberg US Agg index, the Fund’s primary illustrative benchmark.
Performance versus Illustrative Indices (%)1
| Return | Yield* | ||
|---|---|---|---|
| Q4 2025 | Trailing 12-month | ||
| Source Capital – NAV | 4.27 | 18.40 | 5.12 |
| Source Capital – NAV | 3.01 | 11.33 | 5.46 |
| 60% MSCI ACWI / 40% BBG US Agg | 2.42 | 16.22 | 2.65 |
| 60% S&P 500 / 40% BBG US Agg | 2.03 | 13.70 | 2.39 |
The Fund’s risk exposure is nearly balanced between Equities and Credit.
Portfolio Exposure (%)2
| Q4 2025 | |
|---|---|
| Equity | |
| Common Stocks | 43.6 |
| Total Equity | 43.6 |
| Credit | |
| Public | 11.6 |
| Private (invested assets only) | 22.0 |
| Total Credit | 33.6 |
| Other Limited Partnerships | 3.8 |
| Other | 0.1 |
| Cash and equivalents | 19.1 |
| Total | 100 |
¹ Comparison to the indices is for illustrative purposes only. An investor cannot invest directly in an index. Fund shareholders may only invest or redeem their shares at market value (NYSE: SOR), which may be higher or lower than the Fund’s net asset value (NAV).
* Source: FPA, FactSet, Bloomberg. As of December 31, 2025. The “yield” shown for the Fund is the NAV distribution yield (also referred to as the Fund’s “distribution rate” as a % of NAV) and the Fund’s Market Price distribution yield (as a % of market price). Dividend yield is used for the MSCI ACWI and the S&P 500. Yield to Worst is used for the Bloomberg US Agg. Please refer to the Important Disclosures for definitions of the different measures of yield used in this table. For more information related to the Fund’s distribution rate, please see https://fpa.com/fund/source-capital/. Dividends and other distributions are not guaranteed.
² Source: FPA, as of December 31, 2025. Portfolio composition will change due to ongoing management of the Fund. Cash includes the non-invested portion of private credit investments. Totals may not add up to 100% due to rounding.
Past performance is no guarantee, nor is it indicative, of future results.
Portfolio Discussion3
Equity
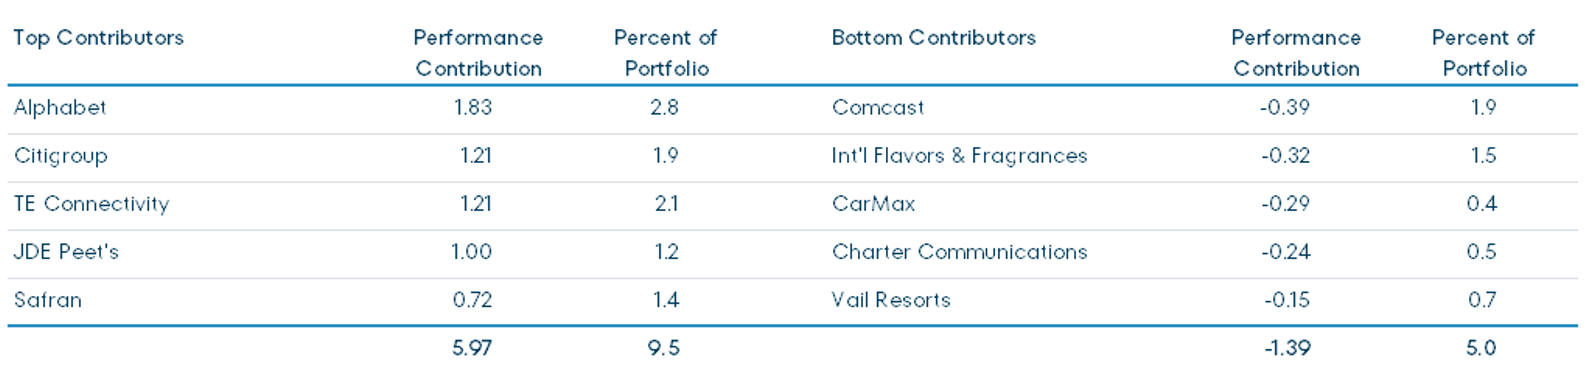
With respect to the recent performance of the Fund, in the previous twelve months, Source’s top five equity performers contributed 5.97% to its return while its bottom five detracted 1.39%.
Trailing Twelve-Month Top and Bottom Contributors (%) as of December 31, 20254
³ References to individual securities are for informational purposes only, are subject to change, and should not be construed as a recommendation or a solicitation to buy or sell a particular security. Portfolio composition will change due to ongoing management of the Fund. Portfolio holdings for the Fund can be found at fpa.com.
⁴ Reflects the top five contributors and detractors to the Fund’s performance based on contribution to return for the trailing twelve months (“TTM”). Contribution is presented gross of investment management fees, transactions costs, and Fund operating expenses, which if included, would reduce the returns presented. Percent of portfolio reflects the average position size over the period. The information provided does not reflect all positions purchased, sold or recommended by FPA during the quarter. A copy of the methodology used and a list of every holding’s contribution to the overall Fund’s performance during the TTM is available by contacting FPA Client Service at [email protected]. It should not be assumed that recommendations made in the future will be profitable or will equal the performance of the securities listed. Totals might not add up due to rounding.
Past performance is no guarantee, nor is it indicative, of future results.
We will review the following companies that have notably impacted the Fund’s performance.5
Longtime holding TE Connectivity benefitted in 2025 from continued demand growth in several of the markets in which it sells into, including: AI infrastructure and data center connectivity; energy and grid update cycling; and industrial automation. TE also acquired Richards Manufacturing earlier in the year, which helped strengthen the company’s competitive position in industrial and utility markets, and raised the dividend throughout 2025.
Safran, buoyed by robust aerospace and aftermarket parts demand, reported record profits for the prior year in early 2025. As global air traffic continued to recover and air carriers ramped up maintenance projects, the company saw stronger aftermarket growth and converted operational efficiency gains into higher earnings, prompting management to raise full-year guidance for 2025.
Poor management has plagued International Flavors & Fragrances for years. As a leading producer of food, beverage, scent, home and personal care, and health products and ingredients, its products are ubiquitous across many household staples. They produce one-third of probiotics, the enzyme used in half of cold-water laundry detergents, another enzyme used in 20% of the beer brewed globally, and one-third of yogurts use an IFF culture, to name a few. Prior management’s reckless capital allocation and ineptitude at managing its diverse global enterprise, transforming a high-margin, unlevered company into one with a lower margin and a higher level of leverage. We have a constructive view of the new CEO, who has renewed the company’s focus on being a best-in-class operationally with a smaller product suite. They have sold, and will continue to sell, non-core assets, which will decrease their leverage and, hopefully, allow for higher margins. The company has burned the market, and many investors have taken a wait-and-see attitude reasonably. We believe that their current $4 of free cash earnings could increase to $5-6 in a few years, and if successful, their P/E should also rise. With its stock currently at $67, a reasonable downside could be around $60, and its upside could be around $125 (a three-year view that excludes free cash flow).6
Vail Resorts operates mountain resorts and ski lodging, with the majority of revenue derived from US properties. It probably goes without saying that one can’t ski without snow. Unfavorable weather conditions throughout 2025 dragged on visitations and skier spending. In addition, rising labor and operational costs have further pressured margins, and management has failed to reassure investors. We believe that Vail’s challenges are more cyclical than structural, and if/when snowfall averages revert, an undemanding valuation could help underpin an increase in the stock price.
Now, if you spend time in our office, you will inevitably overhear our FPA colleague Brian Selmo comment that “Securities ask different questions at different prices.” For securities trading at elevated multiples, the questions are likely to be difficult, if not impossible to answer, and possibly even multiplicative in nature. In other instances, for out of favor names, one is simply determining if the future could be better than the present, with conditions potentially turning positive as the cherry on top.
By focusing on the less challenging questions, we largely avoid the speculative areas of the market where we deem the reward for taking risks insufficient relative to the potential returns. This does not imply that we completely avoid mistakes, but we believe it helps limit the damage when we do err in judgement. Over the last nine years, the end-product of this process has been a strategy that has generated market-leading returns while placing importance on absolute return. Ultimately, this approach requires an unwavering commitment to being “value aware,” a philosophy that underpins our research process.
In doing so, we consider both quantitative and qualitative analysis as we underwrite potential new investments and monitor existing positions. It is not enough to be a great company, nor is it sufficient to simply trade on a superficially low p/e multiple to garner our interest and attention. Instead, we are looking for rare cases where both quality and “value” intersect, even if near-term headwinds may delay the potential payoff.
Hence, when it comes to deploying capital into new names, it is rare that you will find our recent purchases on the 52-week high list. Instead, we thumb our noses at the momentum factor and regularly troll the 52-week low list for potential opportunities. It is in that vein that we let value guide our focus. So, before you pose questions on our upcoming conference call, we don’t have any unique insight into American exceptionalism or whether we are in an AI bubble. Well, you can still ask, but we don’t think we know the answer.
However, we do believe that the investment community is currently casting its gaze away from various market constituents that offer asymmetric risk-reward for those willing to look forward three to five years. We primarily speak of global securities with lower market capitalizations, and, up until recently, healthcare stocks. As you can see from the image below, new purchases over the past two years are clear evidence that we are willing to back up this view with our actions and not just our words.
5 Historical commentaries for the Fund can be accessed on the website at https://fpa.com/insights/. The company data and statistics referenced in this section, including competitor data, are sourced from company press releases, investor presentations, financial disclosures, SEC filings, or company websites, unless otherwise noted.
6 As relates to IFF: Projections on consensus future free cash earnings are based on FPA’s analysis of the last 12 months’ actual and forward-looking consensus estimates. FPA has applied a range of $5.00-6.00 for free cash earnings based on forward-looking free cash earnings, which is lower than the current consensus for those same periods. Based on these three inputs ((a) consensus future free cash flow earnings, (b) conservative P/E metrics relative to IFF’s peer group, and (c) FPA analysis based on IFF company financials), FPA believes that it is possible that the IFF stock price could double in the next few years. Although we believe this estimate has a reasonable basis, it is hypothetical and not guaranteed.
Past performance is no guarantee, nor is it indicative, of future results.
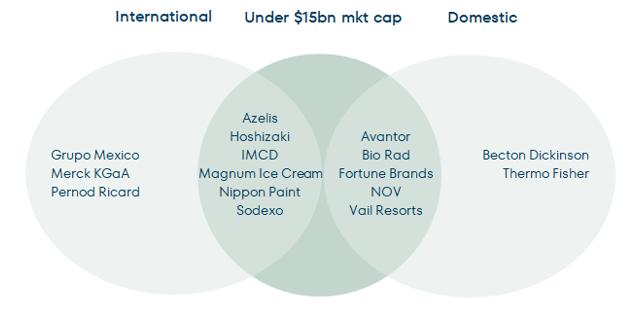
While few of the above are household names, we believe each holds a strong competitive position in their respective industry, if not market leadership. Furthermore, we would go so far as to say we believe we purchased them at absolute values that we believe will help us achieve equity-like returns over the coming years, and at bargain-like valuations compared to the S&P 500.
As for the why, we know not the answer, but we have our suspicions. With the recent outperformance of large US technology companies, not to mention the adoption of passive investing, there may be a shrinking pool of active investors with the interest, resources, and capital to conduct in-depth research on 1) lower market-cap names, and 2) ideas that necessitate deferred gratification longer than one to two quarters. And as it relates to the active investors hoovering up assets, in our experience it is rare to find a pod shop on the share registers of, say, Azelis, Nippon Paint, Sodexo, or NOV.
Lastly, there’s a good reason why the commentary above does not necessarily jive with all of our holdings, say such as some of our top holdings by weight Alphabet (purchased in our flagship Contrarian Value Strategy in 2010), Meta (2018), Analog Devices (2011), and TE Connectivity (2012). We use these names to remind you that our average holding period is in excess of five years, and for those in the top ten, demonstrably longer. We purchased each of the aforementioned “GARPy” names initially when they were making headlines for the wrong reasons, and we would argue their present standing does not betray our ethos as price-disciplined investors, but rather is indicative of our research process and strategy working as intended… sometimes the high case does actually play out!7
7 GARP = Growth At a Reasonable Price. Past performance is no guarantee of future results. It should not be assumed that an investment in the securities mentioned was or will be profitable. The Fund’s full list of holdings as of the most recent period can be found at https://fpa.com/fund/source-capital/#tab-fund-holdings. The information provided does not reflect all positions purchased, sold or recommended by FPA during the period.
Past performance is no guarantee, nor is it indicative, of future results.
Now, as an example of a tough question currently being posed by the market, we submit Microsoft, a company we actually owned in the Contrarian Value Strategy from 2010 to 2020 and Source from the time your current PMs took over in 2015 to 2020. To begin, we hold management in the highest regards, particularly the CEO and CFO, who created tremendous value for us during our ownership. When we originally purchased Microsoft back in 2010, the valuation was less than 10x after-tax earnings after subtracting the cash on the balance sheet. The question we had to ask at the time was whether Microsoft was a melting ice cube, or could the company deliver an equity-type rate of return even if earnings never grew again. To our regret, we sold Microsoft too early, failing to appreciate how technological developments, particularly those of AI/cloud, would transform the business.
In the five years following our sale, from 2020 through 2025, Microsoft grew its top line at a 12% compound annual growth rate (“CAGR”), and its bottom line even faster! But let’s now look at what one must believe to be constructive on the return prospects at the current multiple of 30x+ earnings. Of course, 30x earnings on its own is not necessarily the wrong multiple if Microsoft can continue to grow at a double-digit rate over the coming five years, and market analysts have noted that the valuation looks inexpensive five years out even if revenue were only to grow at a more pedestrian CAGR of 10% during this period.
Stepping back, we will note that Microsoft generated $293bn of revenue over the last twelve months. If revenue were indeed to grow at 10% CAGR over the next five years, Microsoft would theoretically generate $472bn in revenue in 2030, an increase of $178bn. The bulls will say this is achievable based on growth in the core business and an expanding total available market (“TAM”). However, to put the $178bn increase into perspective, Microsoft would need to add revenue greater than the aggregate sales of ERP leaders Oracle and SAP, who generated ~$100bn in combined sales over the past twelve months. The bulls may say that our thinking is too narrow; vibe coding will also allow Microsoft to serve as the foundation or platform upon which corporations will create low-cost alternative solutions for CRM solutions (Salesforce: $40bn revenue), HR software (Workday: $9bn revenue), and new database products (Snowflake: $4.4bn revenue). Moreover, as the bulls believe, from a horizontal perspective, agentic AI will enable Microsoft to offer services to automate and manage digital workflows (ServiceNow: $12bn revenue) across industries. If that was not enough, the bulls will remind us that Microsoft has a consumer gaming franchise in Xbox that will grow over time (Nintendo: $12bn revenue).
To put the words into a picture, for Microsoft to grow at 10% over the next five years, one must believe the company will generate incremental revenue currently generated by the combination of:*
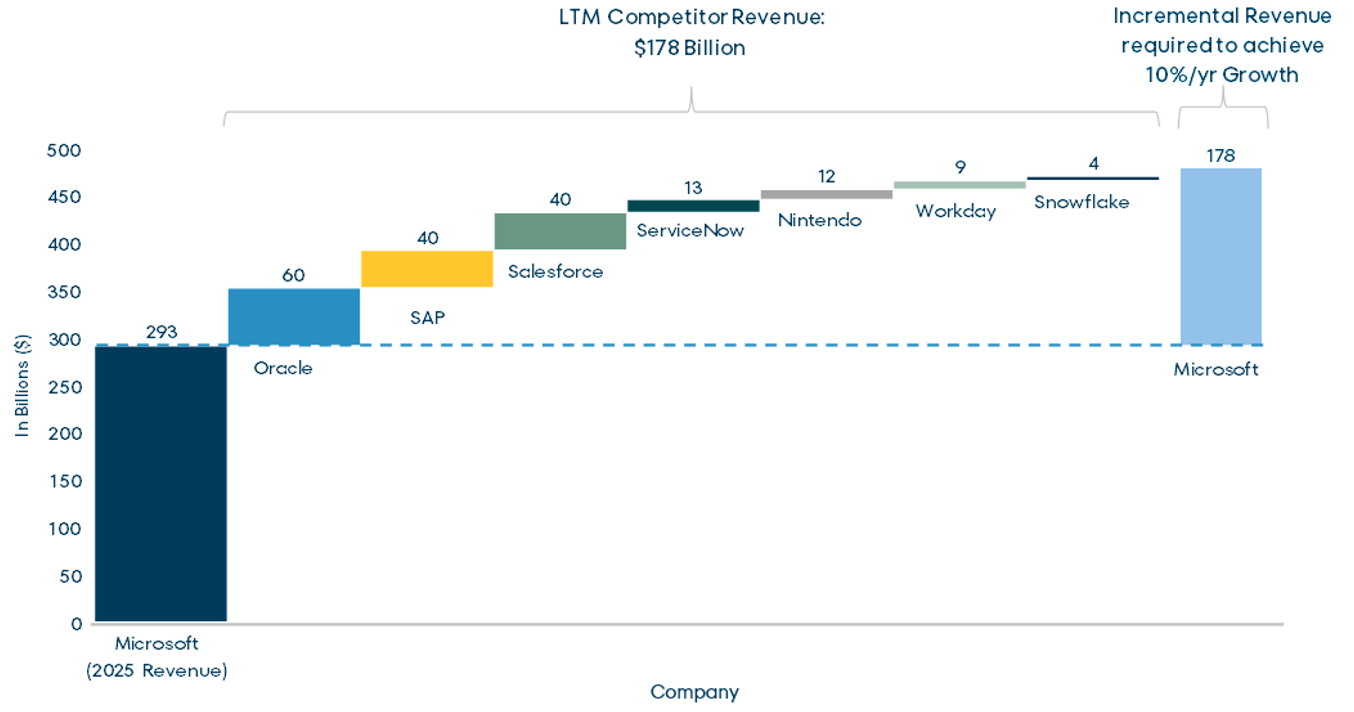
* Forward looking. Refer to the Important Information and other disclosures at the back of this material.
We are not saying this can’t happen, but thankfully as benchmark agnostic investors, there is nothing forcing us to make the wager that it will. Speaking of wagers, we are regularly asked whether the higher-than-average multiples, particularly in US markets, make us inclined to believe a near-term market wobble lies around the corner. To that we emphatically answer “Yes” from our square offices, but with the caveat that we don’t know from which corner. And so rather than make top-down bets, we simply go about our business conducting bottoms-up fundamental analysis with the hope that it helps us find a handful of good ideas each year and keeps us away from the bad ones.
Fixed Income
Traditional
Aside from adding to an existing position during the fourth quarter, we did not generally view Credit (investments rated BBB or lower) as attractively priced. We seek to opportunistically invest in Credit when we believe prices adequately compensate for the risk of permanent impairment of capital and near-term mark-to-market risk.
Over the past few months, spreads on high yield debt continued a downward trend that has been ongoing for several quarters, leaving spreads in historically low territory:
Bloomberg U.S. Corporate High-Yield and BB ex. Energy Index Yield-To-Worst (YTW) and Spread8
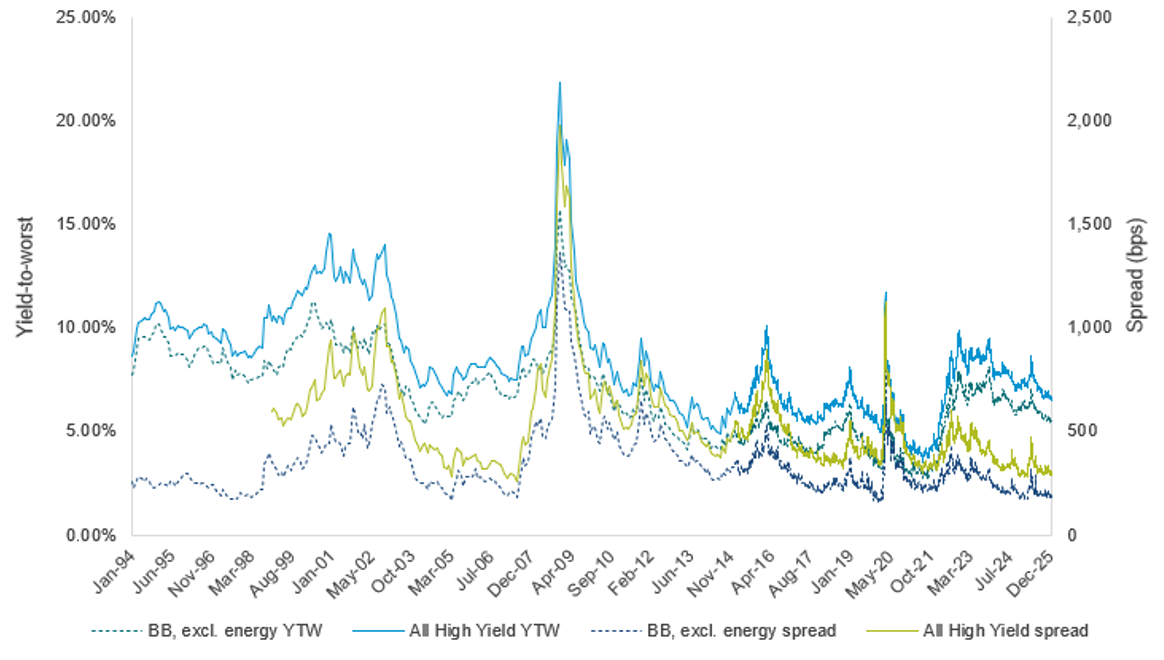
8 Source: Bloomberg. As of December 31, 2025. YTW is Yield-to-Worst. Spread reflects the quoted spread of a bond that is relative to the security off which it is priced, typically an on the-run Treasury. Please see Important Disclosures for definitions of key terms.
Past performance is no guarantee, nor is it indicative, of future results.
Historically low spreads have created an historically expensive market. We have been responding by reducing the Fund’s exposure to high yield and other lower-rated debt. There are several reasons for this shift:
First, buying debt at spreads that offer insufficient compensation for credit risk increases the risk of permanent impairment of capital due to credit losses. Permanent impairment of capital negatively affects short- and long-term returns. Spreads measure the compensation for taking on credit risk in debt that is not “risk-free”, i.e., Treasuries. Low spreads translate to low compensation for credit risk. In addition to the usual credit risks associated with the characteristics of a particular borrower, these days we face additional risks from federal government policy – risks that were not significant throughout the market history shown in the charts above. All things being equal, one would expect more spread to compensate for these additional risks, not less spread, let alone historically low spread. Stated another way, historically low spreads might make sense if one had a very high degree of confidence in a strong economy and business and consumer prospects. As any good debt investor should be, we are always downside-focused and not optimistic by nature. Nevertheless, we do not share the optimism, nor do we see the certainty of outcome, needed to justify such low spreads.
Second, the opportunity cost of reducing credit exposure is low. Not only are spreads low on an absolute basis, but relative spreads among some types of debt are also low because the market has become less discriminating about risk. For example, as of December 31, the spread on BB-rated high yield bonds, excluding energy, was only 113 bps greater than the spread on investment grade corporate bonds. In a historical context, 113 bps of excess spread is at the third percentile, meaning that 97% of the time this excess spread has been greater than 113 bps. We are potentially giving up some extra return by reducing credit exposure but that extra return is historically low. It is important to highlight that we say we are “potentially” giving up some extra return. All things being equal, we are giving up return if spreads do not change or if spreads decrease. Both scenarios seem unlikely given that we are starting from historically low levels of spread. In fact, as shown in the chart below, historically, when spreads have been this low, Treasuries have outperformed high yield over the subsequent 12 months. We choose not to invest based on hope for lower spreads.
High Yield Spread vs. Forward Excess Return9
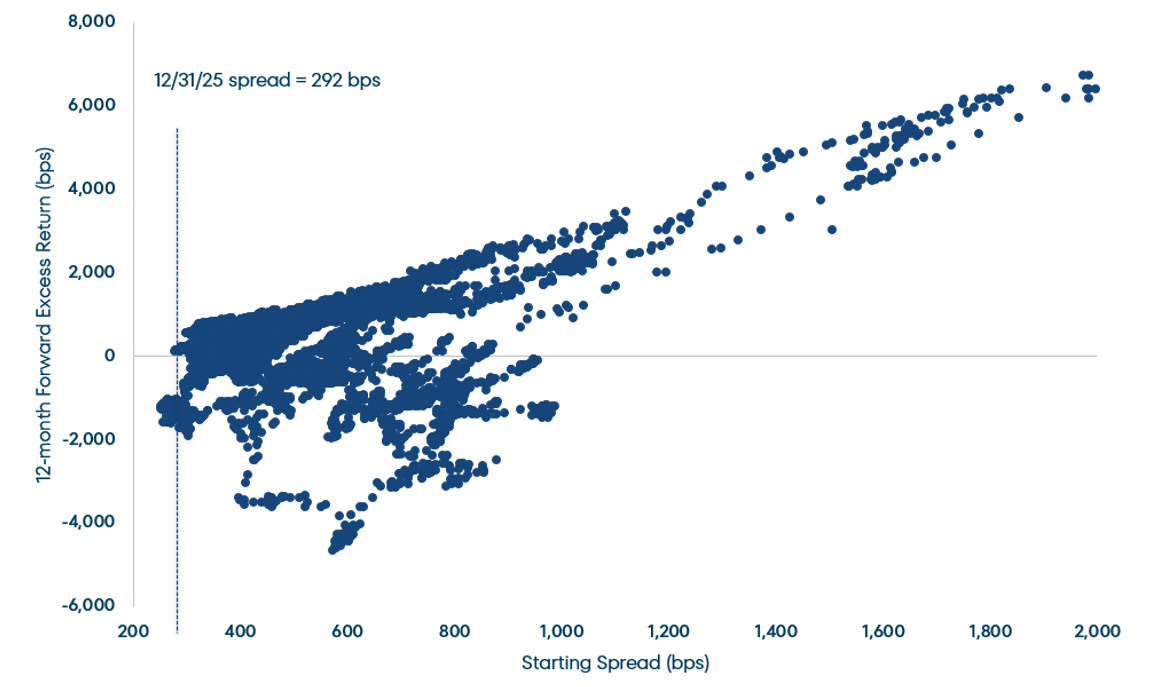
9 Source: Bloomberg; As of December 31, 2025. Chart covers the period 11/27/98 to 12/31/24 and shows the forward one-year return on the Bloomberg U.S. Corporate High Yield Index in excess of the return on similar duration Treasuries versus the starting spread on that high yield index at the start of each one-year period. Please see Important Disclosures for definitions of key terms.
Past performance is no guarantee, nor is it indicative, of future results.
Finally, buying debt at low spreads increases the likelihood of short-term mark-to-market price declines associated with an increase in spread. The lower the spread, the greater the deviation from historical norms; thus, the greater the potential short-term price decline. The same is true for buying at low yields. Some might say that this mark-to-market risk does not matter for buy-and-hold investors: as long as bonds are held to maturity, it does not matter if changes in spread cause bond prices to fluctuate in the interim. The problem with that argument is that buy-and-hold investors may eventually see the dollar value of their fixed income investments recover to their cost basis as maturity approaches but, depending on the severity of the price decline, recovery can take a long time. Therefore, not only is a return of capital delayed but a return on capital is lost. In general, paying high prices for investments can lead to capital destruction versus the alternative of being mindful of entry points. For example, using the Bloomberg High Yield Index as a proxy, investors who paid peak prices for high yield in 2020-2021 would have had to wait two years to recover the value of their cost basis following the yield- and spread-induced selloff that occurred in 2022.10
10 The index value of the Bloomberg High Yield Index peaked at 2,461 in December 2021 and recovered to 2,480 by December 2023.
Private Credit
Source has 26.1% committed to private credit (including called and uncalled capital) as of quarter-end. We continue to look for opportunities to increase that exposure.
Corporate & Other
Distribution
On November 21, 2025, the Fund’s Board approved maintaining the current rate of 20.83 cents per share for its regular monthly distribution through February 2026.11 This equates to an annualized unlevered distribution rate of 5.46% based on the Fund’s closing market price on December 31, 2025.
Discount to NAV
The Fund’s discount to NAV closed at 6.21% at quarter-end. The average discount to NAV for the trailing twelve months was 4.63%.12
Closing
We appreciate the long-term partnership we’ve had with so many of our like-minded investors who maintain a similar “value aware” point of view and long holding period. To the old and the new, we seek to continually earn your trust through the inevitable market cycles with the capital you have entrusted to us.
Respectfully submitted,
Source Capital Portfolio Managers
February 10, 2026
11 For more information related to the Fund’s distribution rate, please see https://fpa.com/insights/?category_name=fund-announcements. Dividends and other distributions are not guaranteed.
12 Source: FPA. The average is calculated using daily discount rates.
Past performance is no guarantee, nor is it indicative, of future results.
Important Information
This Commentary is for informational and discussion purposes only and does not constitute, and should not be construed as, an offer or solicitation for the purchase or sale with respect to any securities, products or services discussed, and neither does it provide investment advice. This Commentary does not constitute an investment management agreement or offering circular.
Current performance information is updated monthly and is available by calling 1-800-982-4372 or by visiting fpa.com. Performance data quoted represents past performance, which is no guarantee of future results. Current performance may vary from the performance quoted. The returns shown for Source Capital are calculated at net asset value per share, including reinvestment of all distributions. Returns do not reflect the deduction of taxes that a shareholder would pay on Fund distributions, which would lower these figures. Since Source Capital is a closed-end investment company and its shares are bought and sold on the New York Stock Exchange, your performance may also vary based upon the market price of the common stock.
The Fund is managed according to its investment strategy which may differ significantly in terms of security holdings, industry weightings, and asset allocation from those of the comparative indices. Overall Fund performance, characteristics and volatility may differ from the comparative indices shown.
There is no guarantee the Fund’s investment objectives will be achieved. You should consider the Fund’s investment objectives, risks, and charges and expenses carefully before you invest. You can obtain additional information by visiting the website at https://fpa.com/fund/source-capital/, by email at [email protected], or toll free by calling 1-800-279-1241.
Effective January 1, 2025, Source Capital, Inc. was reorganized into a Delaware Trust. The Fund’s new name is Source Capital, but it continues to trade on the NYSE under the SOR ticker. There was no change in its investment objective, investment strategy, or fundamental investment policies. FPA continues to be the adviser to the Fund.
The views expressed herein and any forward-looking statements are highly speculative, current only as of the date of this publication and are those of the portfolio management team. Forward-looking statements can be identified by the use of terms such as “may”, “will”, “should”, “expect”, “anticipate”, “project”, “estimate”, “intend”, “continue” or “believe” (or the negatives thereof) or other variations thereof. Due to various risks and uncertainties, actual events or results or actual performance may differ materially and are subject to change at any time in response to changing circumstances and industry developments. This information and data has been prepared from sources believed reliable, but the accuracy and completeness of the information cannot be guaranteed and is not a complete summary or statement of all available data. FPA does not undertake to update any forward-looking statement because of new information, future developments, or otherwise.
Portfolio composition will change due to ongoing management of the Fund. References to individual financial instruments or sectors are for informational purposes only and should not be construed as recommendations by the Fund or the portfolio managers. It should not be assumed that future investments will be profitable or will equal the performance of the financial instrument or sector examples discussed. The portfolio holdings as of the most recent quarter-end may be obtained at fpa.com.
Investing in closed‐end funds involves risk, including loss of principal. Closed‐end fund shares may frequently trade at a discount (less than) or premium (more than) to their net asset value. If the Fund’s shares trade at a premium to net asset value, there is no assurance that any such premium will be sustained for any period of time and will not decrease, or that the shares will not trade at a discount to net asset value thereafter.
Capital markets are volatile and can decline significantly in response to adverse issuer, political, regulatory, market, or economic developments. It is important to remember that there are risks inherent in any investment and there is no assurance that any investment or asset class will provide positive performance over time.
The Fund may purchase foreign securities, including American Depository Receipts (ADRs) and other depository receipts, which are subject to interest rate, currency exchange rate, economic and political risks; these risks may be heightened when investing in emerging markets. Non‐U.S. investing presents additional risks, such as the potential for adverse political, currency, economic, social or regulatory developments in a country, including lack of liquidity, excessive taxation, and differing legal and accounting standards. Non‐U.S. securities, including American Depository Receipts (ADRs) and other depository receipts, are also subject to interest rate and currency exchange rate risks.
The return of principal in a fund that invests in fixed income instruments is not guaranteed. The Fund’s investments in fixed income instruments have the same issuer, interest rate, inflation and credit risks that are associated with underlying fixed income instruments owned by the Fund. Such investments may be secured, partially secured or unsecured and may be unrated, and whether or not rated, may have speculative characteristics. The market price of the Fund’s fixed income investments will change in response to changes in interest rates and other factors.
Generally, when interest rates go up, the value of fixed income instruments, such as bonds, typically go down (and vice versa) and investors may lose principal value. Credit risk is the risk of loss of principle due to the issuer’s failure to repay a loan. Generally, the lower the quality rating of an instrument, the greater the risk that the issuer will fail to pay interest fully and return principal in a timely manner. If an issuer defaults, the security may lose some or all its value. Lower rated bonds, convertible securities and other types of debt obligations involve greater risks than higher rated bonds.
Mortgage-related and asset-backed securities are subject to prepayment risk, can be highly sensitive to changes in interest rates, and are subject to credit risk/risk of default on the underlying assets… Convertible securities are generally not investment grade and are subject to greater credit risk than higher‐rated investments. High yield securities can be volatile and subject to much higher instances of default. The Fund may experience increased costs, losses and delays in liquidating underlying securities should the seller of a repurchase agreement declare bankruptcy or default.
The ratings agencies that provide ratings are Standard and Poor’s (“S&P”), Fitch, Moody’s, Kroll, DBRS, and any other nationally recognized statistical rating organization (“NRSRO”). Credit ratings range from AAA (highest) to D (lowest). Bonds rated BBB or above are considered investment grade (IG). Credit ratings of BB and below are lower-rated securities (junk bonds). High-yielding, non-investment grade bonds (junk bonds) (HY) involve higher risks than investment grade bonds. Bonds with credit ratings of CCC or below have high default risk.
Private placement securities are securities that are not registered under the federal securities laws and are generally eligible for sale only to certain eligible investors. Private placements may be illiquid, and thus more difficult to sell, because there may be relatively few potential purchasers for such investments, and the sale of such investments may also be restricted under securities laws.
The Fund may use leverage. While the use of leverage may help increase the distribution and return potential of the Fund, it also increases the volatility of the Fund’s net asset value (NAV), and potentially increases volatility of its distributions and market price. There are costs associated with the use of leverage, including ongoing dividend and/or interest expenses. There also may be expenses for issuing or administering leverage. Leverage changes the Fund’s capital structure through the issuance of preferred shares and/or debt, both of which are senior to the common shares in priority of claims. If short-term interest rates rise, the cost of leverage will increase and likely will reduce returns earned by the Fund’s common stockholders.
Value style investing presents the risk that the holdings or securities may never reach their full market value because the market fails to recognize what the portfolio management team considers the true business value or because the portfolio management team has misjudged those values. In addition, value style investing may fall out of favor and underperform growth or other styles of investing during given periods.
Distribution Rate
Distributions may include the net income from dividends and interest earned by fund securities, net capital gains, or in certain cases it may include a return of capital. The Fund may also pay a special distribution at the end of a calendar year to comply with federal tax requirements. All mutual funds, including closed-end funds, periodically distribute profits they earn to investors. By law, if a fund has net gains from the sale of securities, or if it earns dividends and interest from securities, it must pass substantially all of those earnings to its shareholders or it will be subject to corporate income taxes and excise taxes. These taxes would, in effect, reduce investors’ total return. First Pacific Advisors, LP does not provide legal, accounting, or tax advice.
The Fund’s distribution rate may be affected by numerous factors, including changes in realized and projected market returns, Fund performance, and other factors. There can be no assurance that a change in market conditions or other factors will not result in a change in the Fund’s distribution rate at a future time.
Index Definitions
Comparison to any index is for illustrative purposes only and should not be relied upon as a fully accurate measure of comparison. The Fund may be less diversified than the indices noted herein and may hold non-index securities or securities that are not comparable to those contained in an index. Indices will hold positions that are not within the Fund’s investment strategy. Indices are unmanaged and do not reflect any commissions, transaction costs, or fees and expenses which would be incurred by an investor purchasing the underlying securities and which would reduce the performance in an actual account. You cannot invest directly in an index. The Fund does not include outperformance of any index in its investment objectives.
Bloomberg U.S. Aggregate Bond Index provides a measure of the performance of the US investment grade bonds market, which includes investment grade US Government bonds, investment grade corporate bonds, mortgage pass-through securities and asset-backed securities that are publicly offered for sale in the United States. The securities in the Index must have at least 1-year remaining in maturity. In addition, the securities must be denominated in US dollars and must be fixed rate, nonconvertible, and taxable.
MSCI ACWI NR USD Index (MSCI ACWI) is an unmanaged free float-adjusted market capitalization weighted index that is designed to measure the equity market performance of developed and emerging markets. Net Return (NR) indicates that withholding taxes are applied to dividend reinvestments. MSCI uses the withholding tax rate applicable to non-resident institutional investors that do not benefit from double taxation treaties.
Standard & Poor’s 500 Stock Index (S&P 500) is a capitalization-weighted index which covers industrial, utility, transportation and financial service companies, and represents approximately 75% of the New York Stock Exchange (NYSE) capitalization and 30% of NYSE issues. The S&P 500 is considered a measure of large capitalization stock performance.
60% S&P500 / 40% BBG U.S. Aggregate Bond Index is a hypothetical combination of unmanaged indices and comprises 60% S&P 500 Index and 40% Bloomberg U.S. Aggregate Bond Index.
60% MSCI ACWI / 40% BBG U.S. Aggregate Bond Index is a hypothetical combination of unmanaged indices and comprises 60% MSCI ACWI Index and 40% Bloomberg U.S. Aggregate Bond Index.
Bloomberg U.S. High Yield Index measures the market of USD-denominated, non-investment grade, fixed-rate, taxable corporate bonds.
Bloomberg U.S. High Yield BB ex Energy Index measures the market of USD-denominated, non-investment grade, fixed-rate, taxable BB-rated corporate bonds excluding energy sector.
Glossary of Terms
Compound annual growth rate (CAGR) is the annual rate of return that shows how an investment grows from its beginning value to its ending value over time, assuming reinvested profits.
Discount to Net Asset Value (NAV) is a pricing situation when a closed-end fund’s market trading price is lower than its daily net asset value (NAV).
Dividend Yield is the dividend per share divided by the price per share.
Earnings Per Share (EPS) is calculated as a company’s profit divided by the outstanding shares of its common stock. The resulting number serves as an indicator of a company’s profitability.
Forward Price to Earnings is a version of the ratio of price-to-earnings (P/E) that uses forecasted earnings for the P/E calculation.
Free Cash Flow represents the cash a company can generate after required investment to maintain or expand its asset base.
High-Yield (HY) Bond is a high paying bond with a lower credit rating than investment-grade corporate bonds, Treasury bonds and municipal bonds. Because of the higher risk of default, these bonds pay a higher yield than investment grade bonds.
Investment Grade (IG) is a rating that indicates that a bond has a relatively low risk of default.
Market Capitalization refers to the total dollar market value of a company’s outstanding shares of stock. Commonly referred to as “market cap,” it is calculated by multiplying the total number of a company’s outstanding shares by the current market price of one share.
Net Asset Value (NAV) represents the net value of a mutual fund and is calculated as the total value of the fund’s assets minus the total value of its liabilities and is shown as a per share price.
Price to Earnings is the ratio for valuing a company that measures its current share price relative to its EPS. The price-to- earnings ratio is also sometimes known as the price multiple or the earnings multiple.
Spread reflects the quoted spread of a bond that is relative to the security off which it is priced, typically an on the-run treasury.
Trailing Price to Earnings is a relative valuation multiple that is based on the last 12 months of actual earnings.
Yield is the discount rate that links the bond’s cash flows to its current dollar price.
Yield to Worst (YTW) is a measure of the lowest possible yield that can be received on a bond that fully operates within the terms of its contract without defaulting. It is a type of yield that is referenced when a bond has provisions that would allow the issuer to close it out before it matures.
©2026 Morningstar, Inc. All Rights Reserved. The information contained herein: (1) is proprietary to Morningstar and/or its content providers; (2) may not be copied or distributed; and (3) is not warranted by Morningstar to be accurate, complete, or timely. Neither Morningstar nor its content providers are responsible for any damages or losses arising from any use of this information. Past performance is no guarantee, nor is it indicative, of future results.