
You should consider the Fund’s investment objectives, risks, and charges and expenses carefully before you invest. You can obtain additional information by visiting the website at https://fpa.com/fund/source-capital/, by email at [email protected], or toll-free by calling 1-800-279-1241.
Average Annual Total Returns (%)

Index data source: Morningstar.
Past performance is no guarantee of future results and current performance may be higher or lower than the performance shown. This data represents past performance and investors should understand that investment returns and principal values fluctuate, so that when you redeem your investment it may be worth more or less than its original cost. Current month-end performance data, which may be lower or higher than the performance data quoted, may be obtained at fpa.com or by calling toll-free, 1-800-982-4372.
Periods over one year are annualized. Fund performance is shown net of all fees and expenses and includes the reinvestment of distributions. Returns do not reflect the deduction of taxes that a shareholder would pay on Fund distributions, which would lower these figures. Since Source Capital is a closed-end investment company and its shares are bought and sold on the New York Stock Exchange, your performance may also vary based upon the market price of the common stock. Comparison to any index is for illustrative purposes only. An investor cannot invest directly in an index. The Fund does not include outperformance of any index or benchmark in its investment objectives.
* On December 1, 2015, the Fund transitioned to a balanced strategy and the current portfolio managers assumed management of the Fund on that date.
Please see important disclosures at the end of this commentary.
Dear Shareholder:
Performance Overview
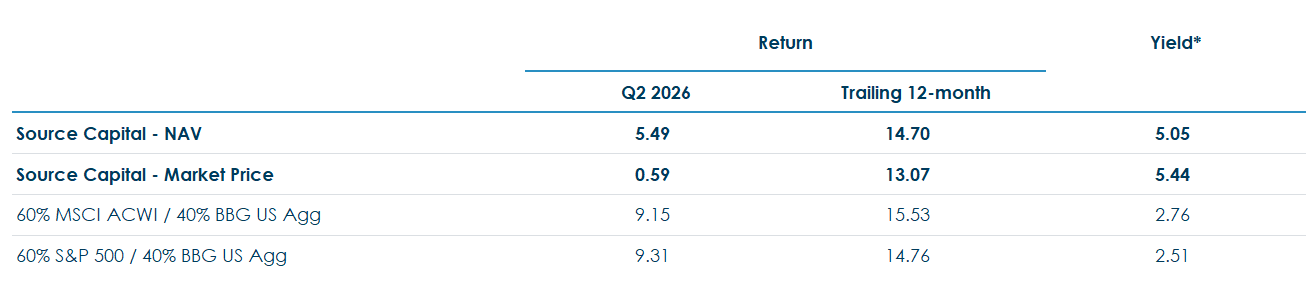
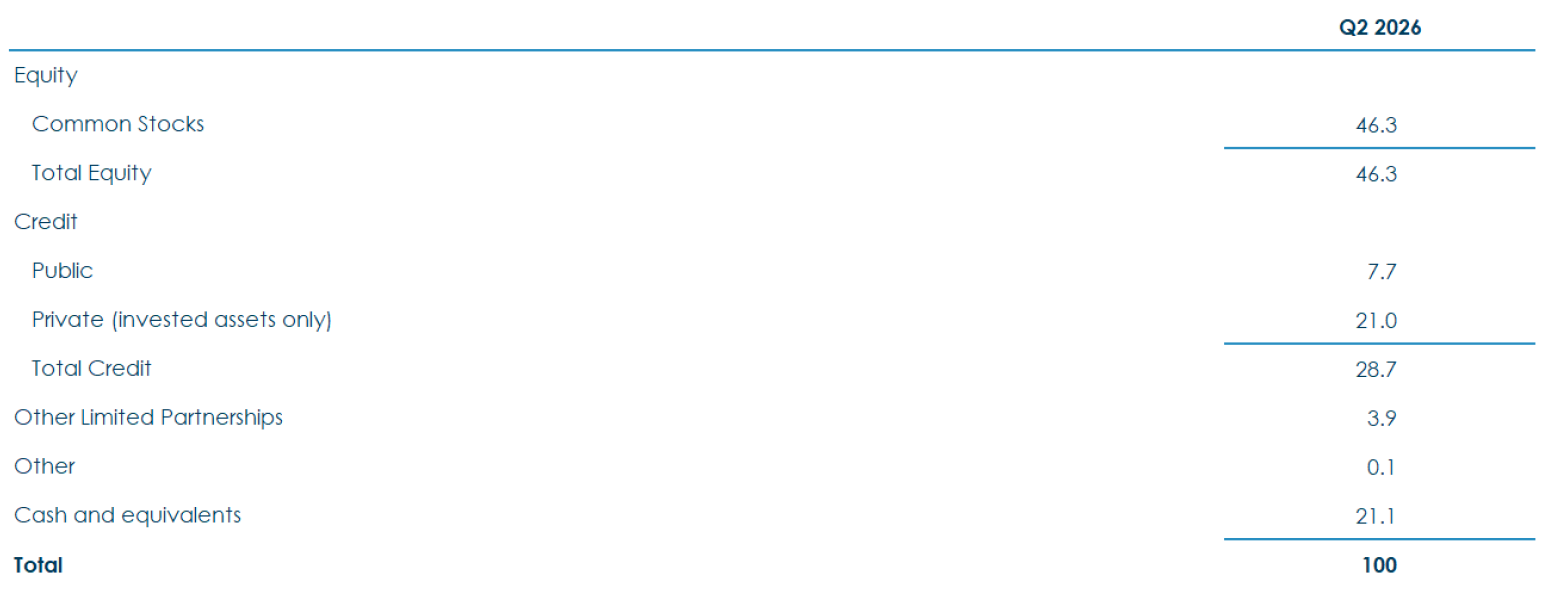
Source Capital’s (“Source” or “Fund”) net asset value (NAV) gained 5.49% for the quarter and 14.70% for the trailing twelve months. It captured 94.7% of the return of the balanced MSCI ACWI/Bloomberg US Agg index, the Fund’s primary illustrative benchmark, over the trailing twelve months. The Fund’s risk exposure is nearly balanced between Equities and Credit.
Performance versus Illustrative Indices (%)1
Portfolio Exposure (%)2
¹ Comparison to the indices is for illustrative purposes only. An investor cannot invest directly in an index. Fund shareholders may only invest or redeem their shares at market value (NYSE: SOR), which may be higher or lower than the Fund’s net asset value (NAV).
* Source: FPA, FactSet, Bloomberg. As of June 30, 2026. The “yield” shown for the Fund is the NAV distribution yield (also referred to as the Fund’s “distribution rate” as a % of NAV) and the Fund’s Market Price distribution yield (as a % of market price). Dividend yield is used for the MSCI ACWI and the S&P 500. Yield to Worst is used for the Bloomberg US Agg. Please refer to the Important Disclosures for definitions of the different measures of yield used in this table. For more information related to the Fund’s distribution rate, please see https://fpa.com/fund/source-capital/. Dividends and other distributions are not guaranteed.
² Source: FPA, as of June 30, 2026. Portfolio composition will change due to ongoing management of the Fund. Cash includes the non-invested portion of private credit investments. Totals may not add up to 100% due to rounding.
Past performance is no guarantee, nor is it indicative, of future results.
Portfolio Discussion3
Equity
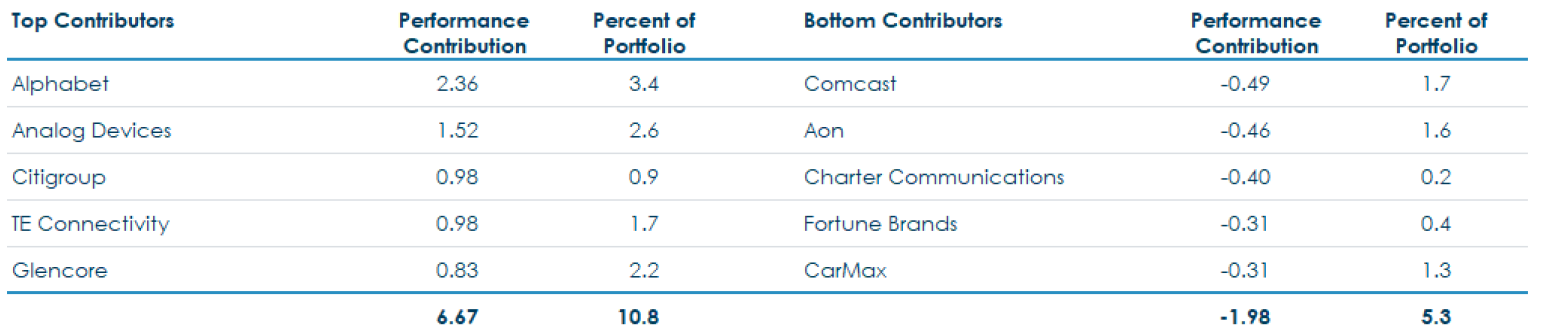
With respect to the recent performance of the Fund, in the previous twelve months, Source’s top five equity performers contributed 6.67% to its return while its bottom five contributed -1.98%.
Trailing Twelve-Month Top and Bottom Contributors (%) as of June 30, 20264
The following companies impacted portfolio performance but have not been recently discussed.5
Analog Devices (“ADI”), a leading supplier of analog and mixed-signal semiconductors, benefited mostly from strong demand tied to AI infrastructure, industrial automation, and communications equipment. During the quarter, shares rose after ADI reported record quarterly results, including 37% year-over-year revenue growth, expanding margins, and management pointing to record bookings across several end markets. Investors were further encouraged by the company’s announced acquisition of Empower Semiconductor (closed in early July) and guidance for continued growth into the second half of the year.
We have discussed our exposure to cable broadband providers, through holdings in Comcast and Charter/Liberty Broadband in the past. Still, the stocks continue to see pressure as fiber and fixed wireless operators take share. Heading into 2020, both stocks had a strong run as residential broadband demand increased when people were forced to work from home. Since that time, shares have sold off and now trade at historically depressed valuations against a backdrop of strong FCF generation and share repurchases. While we aspire to own growing businesses at reasonable valuations, there will periodically also be room in a diversified portfolio for small positions that trade at cheap multiples and reasonable business prospects, which both Comcast and Charter fit at present.
³ References to individual securities are for informational purposes only, are subject to change, and should not be construed as a recommendation or a solicitation to buy or sell a particular security. Portfolio composition will change due to ongoing management of the Fund. Portfolio holdings for the Fund can be found at fpa.com.
⁴ Reflects the top five contributors and detractors to the Fund’s performance based on contribution to return for the trailing twelve months (“TTM”). Contribution is presented gross of investment management fees, transactions costs, and Fund operating expenses, which if included, would reduce the returns presented. Percent of portfolio reflects the average position size over the period. The information provided does not reflect all positions purchased, sold or recommended by FPA during the quarter. A copy of the methodology used and a list of every holding’s contribution to the overall Fund’s performance during the TTM is available by contacting FPA Client Service at [email protected]. It should not be assumed that recommendations made in the future will be profitable or will equal the performance of the securities listed. Totals might not add up due to rounding.
5 Historical commentaries for the Fund can be accessed on the website at https://fpa.com/insights/. The company data and statistics referenced in this section, including competitor data, are sourced from company press releases, investor presentations, financial disclosures, SEC filings, or company websites, unless otherwise noted.
Past performance is no guarantee, nor is it indicative, of future results.
Looking at the broader market, in the six months ending June 30th, equity markets delivered strong returns (11.25% for the ACWI and 10.21% for the S&P 500) and became increasingly narrow. Exciting AI capabilities and data center supply shortages drove the market and economic activity. We continued to find opportunities in attractive mid-sized companies that are largely AI and data center-agnostic.
The following pictures illustrate the market’s narrowness as seen in the indices.
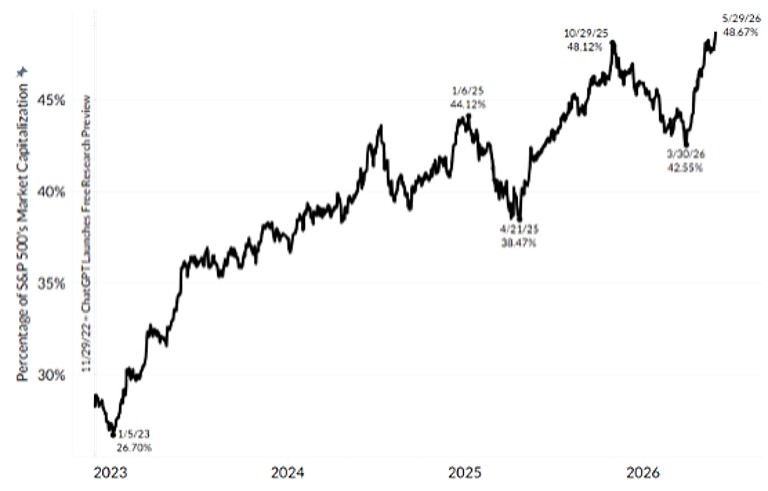
AI-related stocks have captured investors’ minds and wallets, driving the majority of recent stock market returns and, by some counts, accounting for 50% to more than 75% of the S&P 500’s total gains since late 2022.6 According to J.P. Morgan, “AI” companies now constitute approximately 50% of the S&P 500, exceeding even the Information Technology sector’s 35% weight at the then S&P 500 peak in March of 2000.
Weighting of AI-Related Companies in the S&P 500 Index7
Semiconductors and tech hardware now represent nearly 30% of the market, the highest level recorded.
Weighting of Tech Hardware Companies in the S&P 500 Index8
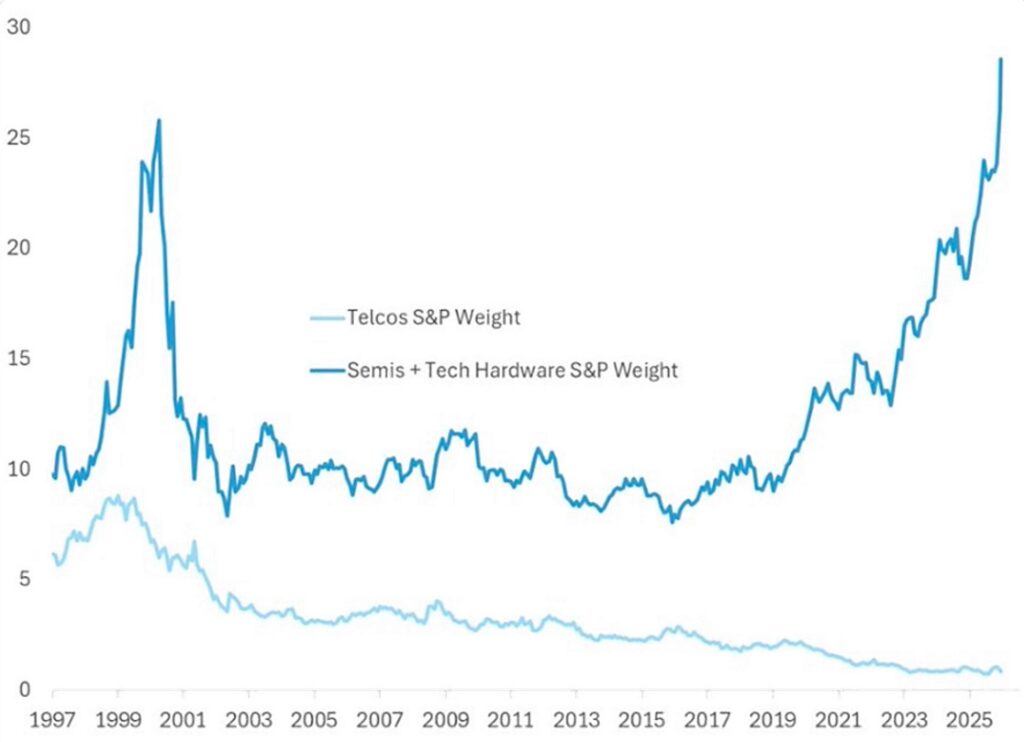
Over the last six months, semiconductors and tech hardware accounted for nearly 90% of the S&P 500 Index’s return.9
Until very late in the second quarter, momentum had been the strongest indicator/driver of returns and relatively more pronounced than in the past.
Ratio of US Momentum stocks to US Minimum Volatility stocks10
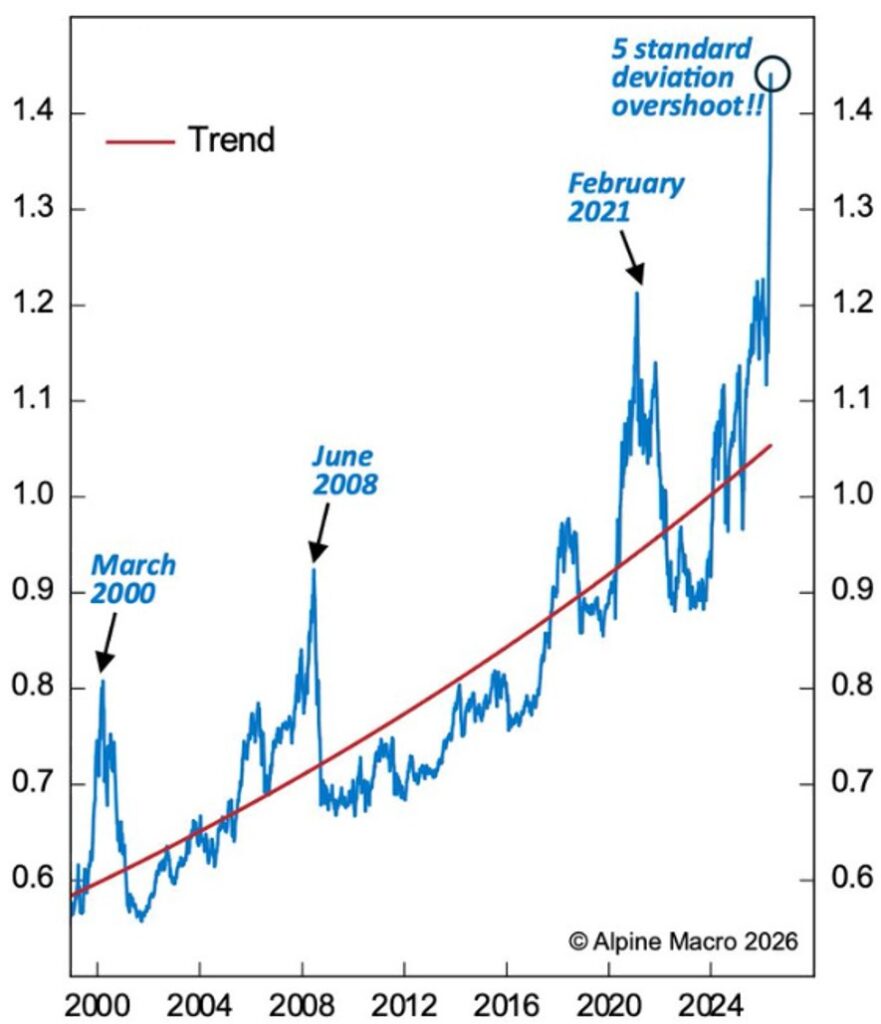
From many vantage points, the market, as expressed by the indices, is quite narrow.
Good reasons underpin the market’s narrowness. Progress in AI, first with OpenAI/ChatGPT and more recently with Anthropic/Claude/Mythos, has provided a credible peek into a future in which humans will massively increase productivity. If one squints, we can imagine machines embedded with intelligence that allow humans to enjoy a substantial surplus of necessary goods/service/comforts without requiring traditional physical/mental labor. While some technologies are speculative and others will take decades to diffuse, the potential is real and probable. If you need convincing, try a Waymo during your next visit to Los Angeles.
Rapid adoption of large language models (LLMs), facilitated by ubiquitous access to smart devices and fear of being left behind, has led to an epic boom for the suppliers of picks and shovels to the AI (datacenter) buildout.
To date, the boom has exceeded expectations. At year-end 2024 investors were generally bullish on Nvidia, ChatGPT had been introduced two years earlier. Nvidia had seen its revenue increase by 4x, and stock increase 6x since the introduction of ChatGPT. Despite being a well-recognized beneficiary of AI-led chip demand, analysts materially underestimated Nvidia’s near-term performance. At year-end 2024, analysts expected 2026 revenue of $130-150bn. Run-rate will be closer to $400bn.11 To date, the correct call on fundamentals has been to be more bullish than the bulls.
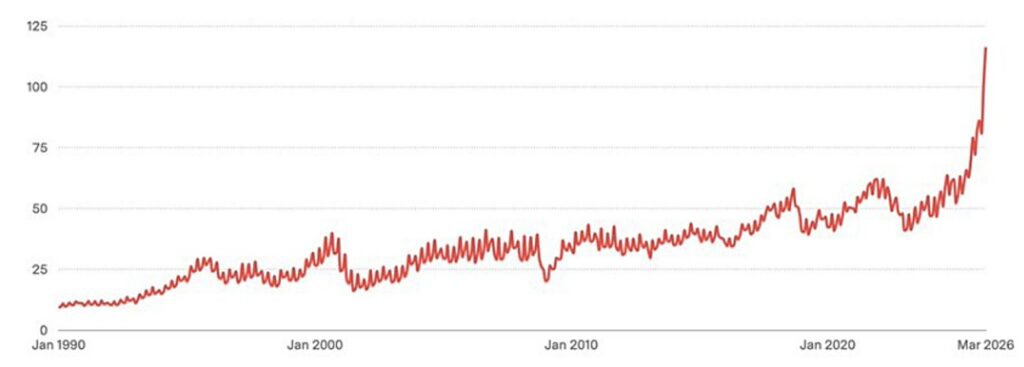
Nvidia is not alone; semiconductor revenue is through the roof, and the memory market has developed an acute shortage.
Monthly Global Semiconductor Billings ($ billions)12
This spending is primarily supported by the hyperscalers.
Big Tech Capital Expenditures ($ billions)13
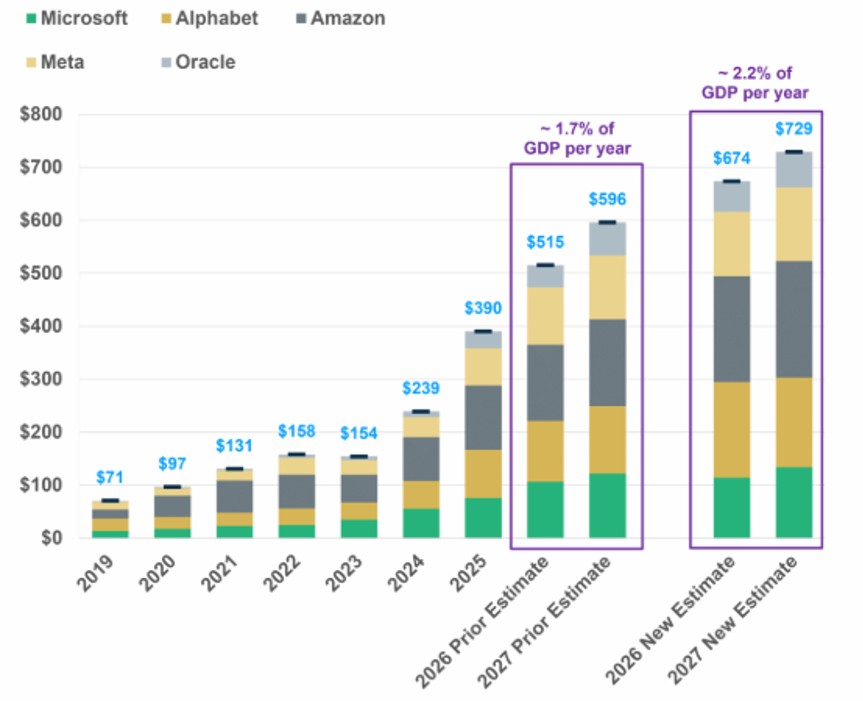
This capital spending comes from cash generated by strong businesses that have seen revenues accelerate over the past few years. More recently, the baton has been passed to the capital markets through both debt and equity issuance. There is some circularity to this activity, but the vortex of activity is real and well-financed (to date).
As of today, there appears to be no limit to demand for compute/data centers, which is a good thing because supply is coming.
The US had 40-53 GW of installed capacity at the beginning of 2026 and should double to 95 GW by the end of 2027.14 As shown below, the total pipeline is nearly 300 GW. There are well-known limits around permitting, power supply, semi/memory and other materials, so substantially less than the pipeline will be delivered, but it appears likely that capacity will multiply in the next few years.
Data Center Capacity by Stage (in GW)15
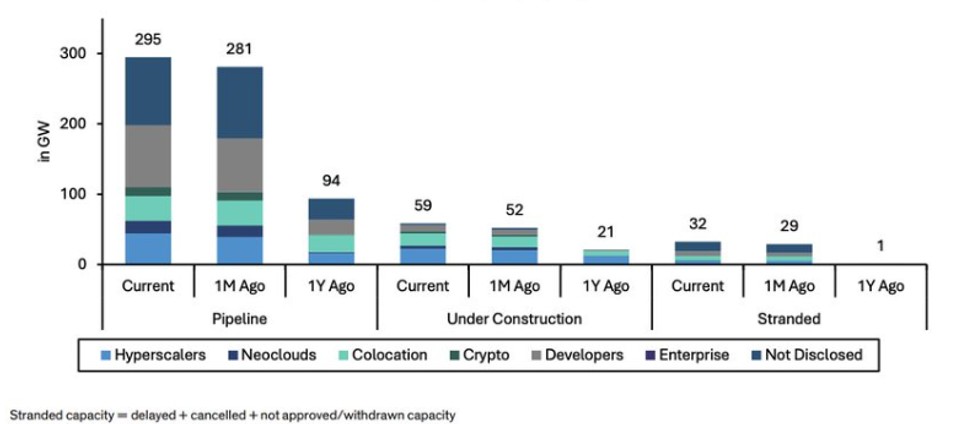
And that’s just on Earth. SpaceX went public in the second quarter at a $1.8T valuation. SpaceX is an awe-inspiring firm and has a credible claim to being the most consequential company on the planet. Still, according to sell-side reports, most of its IPO value is attributable to its speculative promise to build data centers in space. According to Elon, the company will deliver an additional 1 GW per year of capacity in 2027, 10 GW per year beginning in 2028, 100 GW per year beginning in 2030 and eventually 1 TW per year. That’s a lot, and the company appears entirely serious about these intentions, given their active building of mega facilities to supply the necessary equipment.
It appears that, on Earth or in space, the market has confidence (based on valuations of the various businesses pursuing/benefiting from the build-out) that significant compute capacity will be delivered over the next few years. We can’t help but wonder what the returns will be on all this compute spend? Could compute capacity exceed AI’s ability to diffuse usefully through the economy? Currently, the market for compute is in backwardation, with forward 12-to-24-month prices 30 to 40% below the spot price (on, as best we can tell, a like-for-like unit). We are also struck by the recent contracts that SpaceX signed with Google and Anthropic for scaled compute capacity immediately available at prices 2 to 5x estimates of the long-term cost, but cancelable with 90-day notice.
We are bullish on AI and compute demand, but not more bullish than the bulls, and don’t feel that the market is offering us any easy question in the AI/hardware space.
6 Sommer, Jeff. “A.I. Has Rewarded Investors. It May Now Pose Their Greatest Risk.” The New York Times, 10 July 2026.
7 Bianco Research, J.P. Morgan, Bloomberg. As of May 29, 2026. https://x.com/biancoresearch/status/2060813590421016858.
8 Barclays Equities Tactical Strategies (BETS), S&P. Telcos represent the Telecom sector in the S&P 500. As of May 18, 2026. https://x.com/Alty_Markets/status/2055998730180976963.
9 FactSet. As of June 30, 2026.
10 Arvy. When 60% of the S&P 500 Is AI — Quality Becomes the Allocation Question. MSCI, Alpine Macro 2026. Ratio of US Momentum stocks to US Minimum Volatility stocks, based on large- and mid-cap indices within the S&P including the S&P 400.
11 Expected run-rate in 2026. Source: Nvidia.
12 WSTS and US Census. As of March 31, 2026.
13 Carson Group. As of 15 May 2026. Prior estimates are from the end of 2025. https://www.carsongroup.com/insights/blog/theyre-running-it-hot-and-were-still-riding-the-wave/.
14 Source: Goldman Sachs; US Data Center Power Demand Projected to Double by 2027. May 20, 2026. https://www.goldmansachs.com/insights/articles/us-data-center-power-demand-projected-to-double-by-2027.
15 Aterio, Bernstein Analysis. As of 20 May 2026. https://x.com/firstadopter/status/2057089666772320758. GW stands for gigawatts. Hyperscalers include massive data centers, vast cloud computing services, and global network infrastructure. Neoclouds are specialized cloud providers focused on GPU-as-a-Service (GPUaaS), offering high-end hardware compute accelerators, high-bandwidth AI networking, and light virtualization or bare-metal access. Colocation includes physical space, redundant power, precise cooling, tight security, and network connectivity. You rent space while providing your own hardware. Cryptocurrency includes digital coins, alternative tokens, and stablecoins that rely on secure computer code. Developers include wholesale data center developers or real estate firms. An enterprise data center is defined as a private facility owned, operated, and utilized by a single organization to support its internal IT, applications, and corporate workloads.
Past performance is no guarantee, nor is it indicative, of future results.
Difficult Questions
Given the exciting future and economic importance of AI, we spend time using, reading, and thinking about the technology, its near-term impact, and longer-term potential. Currently, we have more questions than answers and must admit that, mostly, we just don’t know.
A recent Invest Like the Best podcast, titled “The Cone of Uncertainty” with Krishna Rao, Anthropic’s CFO, neatly captures our feelings. During the discussion, Rao said, “We think about the world as scenarios. It’s very hard to have a point estimate in this business. And then having a very low bar for updating your current priors, or your current perspective. It could be the case that something a month ago was true that’s just not true today, and that breaks your model, and you have to go back and update it.”
Thus far, all updates – capabilities, revenue, and compute demand — have been positive. Should we expect all future updates to be as favorable? And, has OpenAI had a somewhat different experience in the past six months? In early 2025, OpenAI appeared to be the clear leader among independent frontier labs; today, not so clear.
Annualized Revenue (USD)16
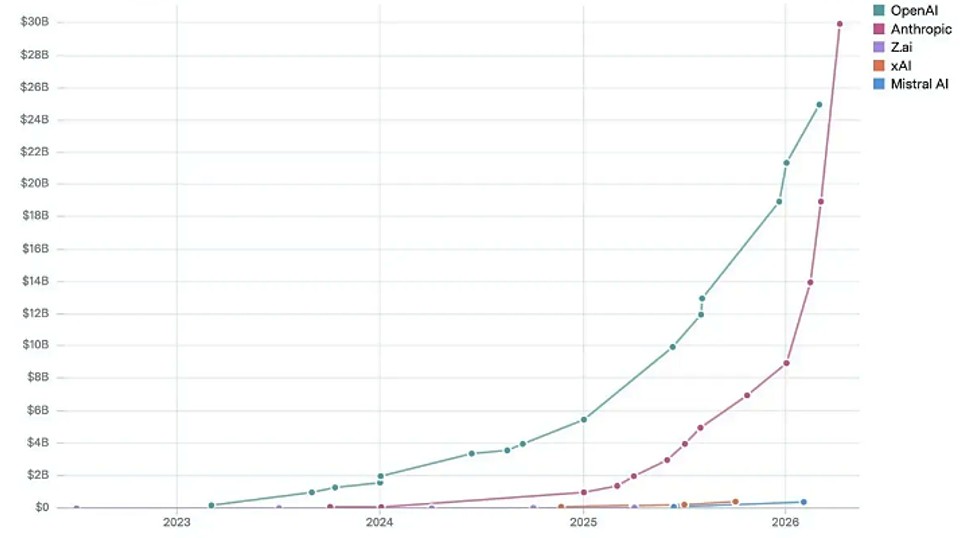
Will frontier lab leadership prove persistent or fleeting? The following chart suggests fleeting.
Selected Frontier LLMs by Aggregate Benchmark Score17
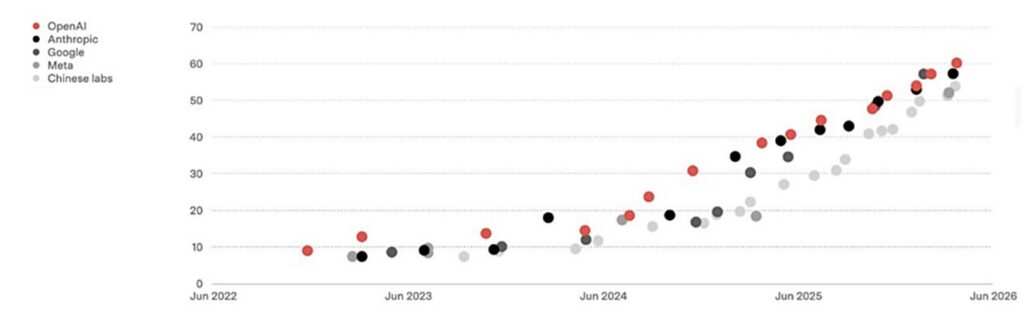
If fleeting, what is the long-term economic return to frontier lab innovation? Where will the economics stick?
Perhaps leadership will be persistent, and if it is, will economic value accrue to the leader, or to the low-cost, slight laggard? Or to some other level of the stack? The following suggests that lagging models (open-source and low-cost) catch up quickly and cost a fraction of the frontier.
Language Model Inference Price ($/million tokens), by Model Intelligence18
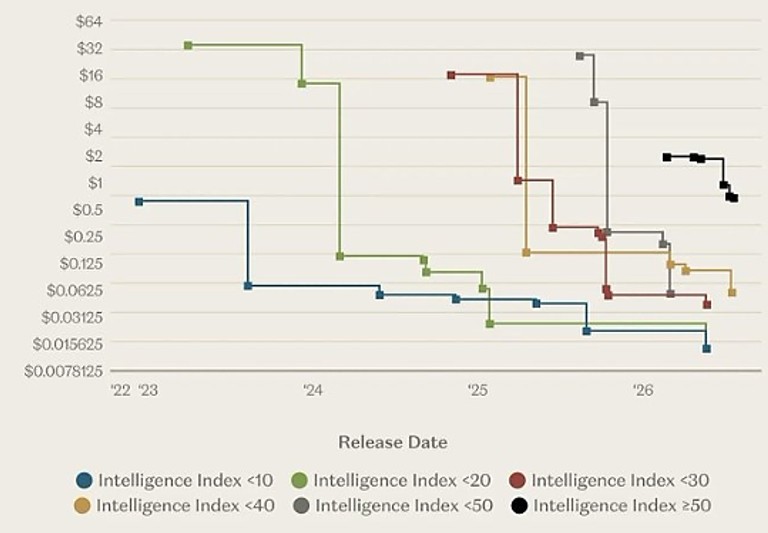
Various reports suggest that companies are moving away from frontier models as costs become uneconomic relative to the value delivered. What activities require genuine frontier or super intelligence? At maturity, how much of the ‘intelligence layer’ can be served by good enough, low-cost commodity models?
Perhaps the most important near-term questions relate to the spend and sustainability of the data center buildout. Direct (semiconductors/memory) and indirect (power, building materials, commodities, engineering firms, and cooling business) beneficiaries are all experiencing massive tailwinds and driving both the economy and markets. The data center build is becoming large relative to GDP and relative to previous infrastructure buildouts.19,20
Some analysis proposes that the data center buildout is like nothing we have ever seen – multiples larger in inflation-adjusted terms than even the US railroad and interstate highway expansions of the 19th and 20th centuries.
Data Centers vs. Megaprojects Inflation-Adjusted Costs21
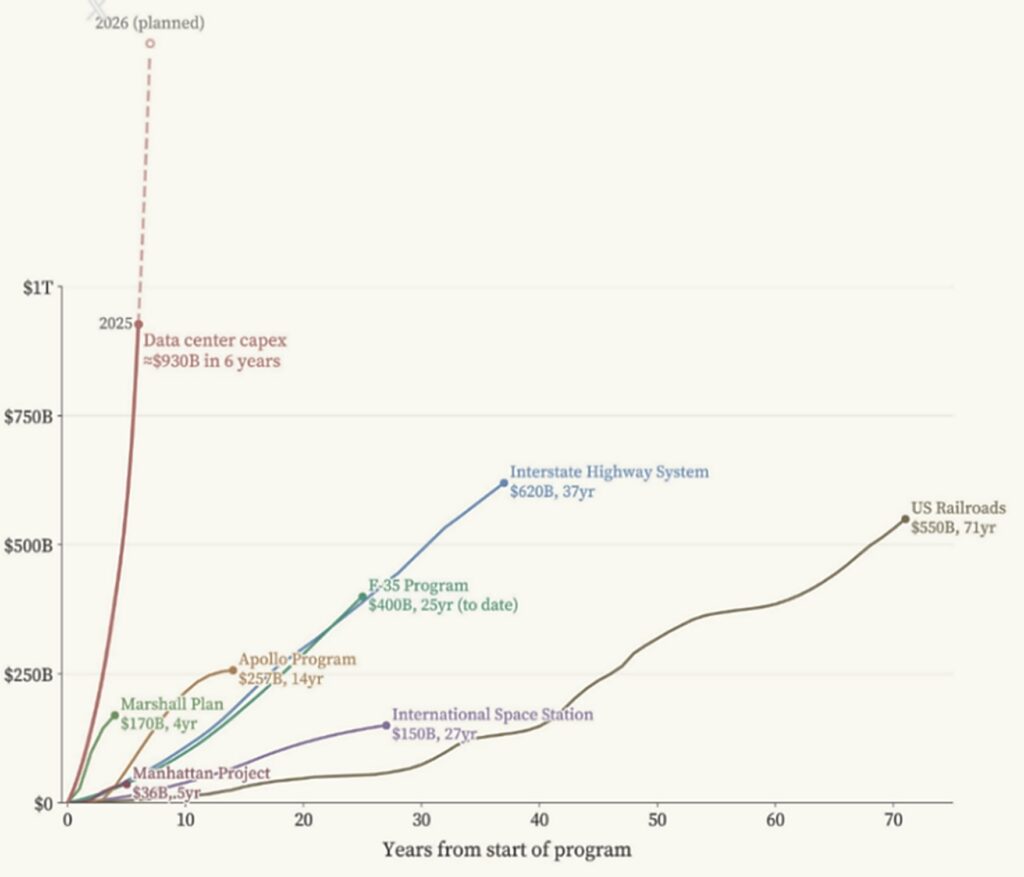
On the other hand, a slightly different lens supports the argument that the buildout is reasonably consistent with past large-scale fundamental infrastructure builds.
Infrastructure Buildout – Cumulative Capex as a Share of World GDP22
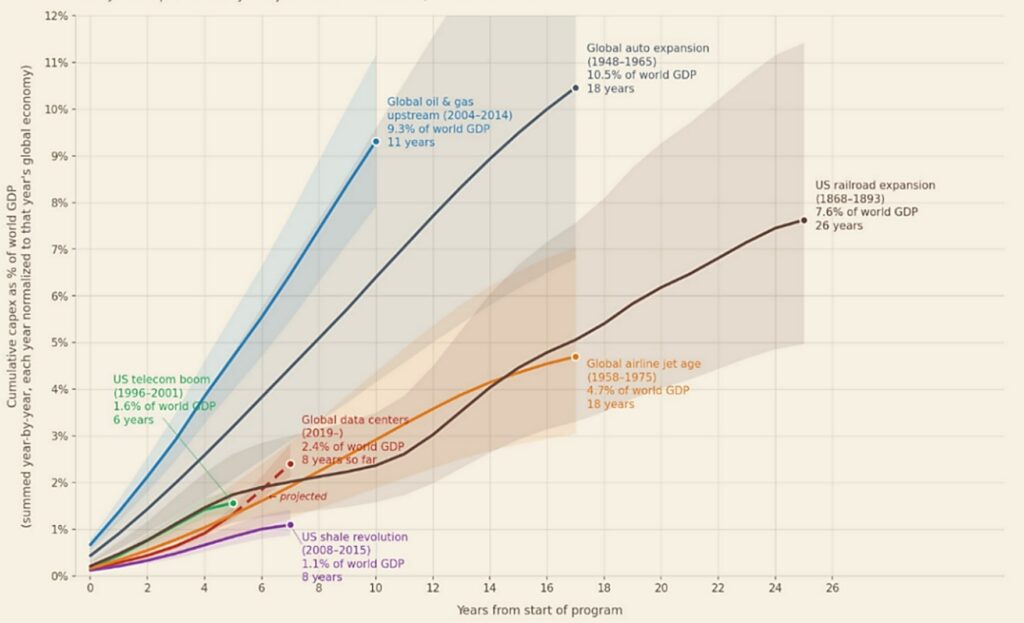
Even the data seems confused. If AI (and the robotic revolution it enables) ultimately satisfies all human needs without the need for traditional human labor, ‘Super-Abundance’, then, perhaps, historic precedents are irrelevant, and compute should represent a massive share of economic activity. But will there be a cycle in what is now a massively capital-intensive industry? And how do intelligence cycles work?
Together, these (and other) questions posed to long-term investors by the AI boom are difficult to answer. We are left uncertain about the sustainability of the current and projected level of AI capital spending and the prospect of it generating reasonable returns on the aggregate investment. Global spending influenced by AI is projected to skyrocket to a record $2.59 trillion in just this year. To achieve even a relatively low unlevered return on investment suggests (an improbable?) $207 billion in after-tax income, per year, starting immediately.23
In some important ways, AI is unique, and we have long invested in businesses that we believe are well positioned for the digital future. Many of the businesses we own (Semiconductors/Hyper-scalers/Connectors) benefit from robust tailwinds from data center expansion and compute utilization. On average, we have owned these companies for over a decade and currently believe that they will each be larger and more profitable 5 and 10 years from now. These businesses are diverse, serve markets beyond just datacenters, and are growing faster than we expected a few years ago. Given expanded valuations and the stage of their capital cycle (far from depressed), we are scaling back exposure because we believe the risk-adjusted returns are less attractive – the margin of safety is shrinking, if not disappearing. We have been more aggressive in exiting the names that have benefited most directly from compute shortages.
Given our excitement about the technology, strength of the companies’ positions and belief that compute demand will be greater over time, we think it is advisable to own a bit of the ‘future’ at a supportable (but potentially stretched valuation) should the capital cycle peter out.
AI is not the first theme markets have focused on that requires long-term investors to answer difficult questions in the affirmative. Since we have been managing our flagship Contrarian Value strategy, we recall the early web companies in the Dot-com era, Commodity Super-Cycle, EM Premium (remember the BRICs), MLP enthusiasm, SAAS, and Healthcare/Covid ‘winners’. In each of those cases, we generally avoided the theme based on what we viewed as unsustainable valuations at stretched points in the capital cycle.
Our strategy is similar in the current environment. We seek investments that are asking long-term investors easier questions. Today, we have the opportunity to buy businesses we consider relatively AI-agnostic businesses at valuations that support what we see as an attractive expected absolute return. In the first half of the year, we added 13 new companies and increased our holdings in several companies purchased last year. They fit nicely in the Venn diagram we shared at the end of last year, updated below through June.24
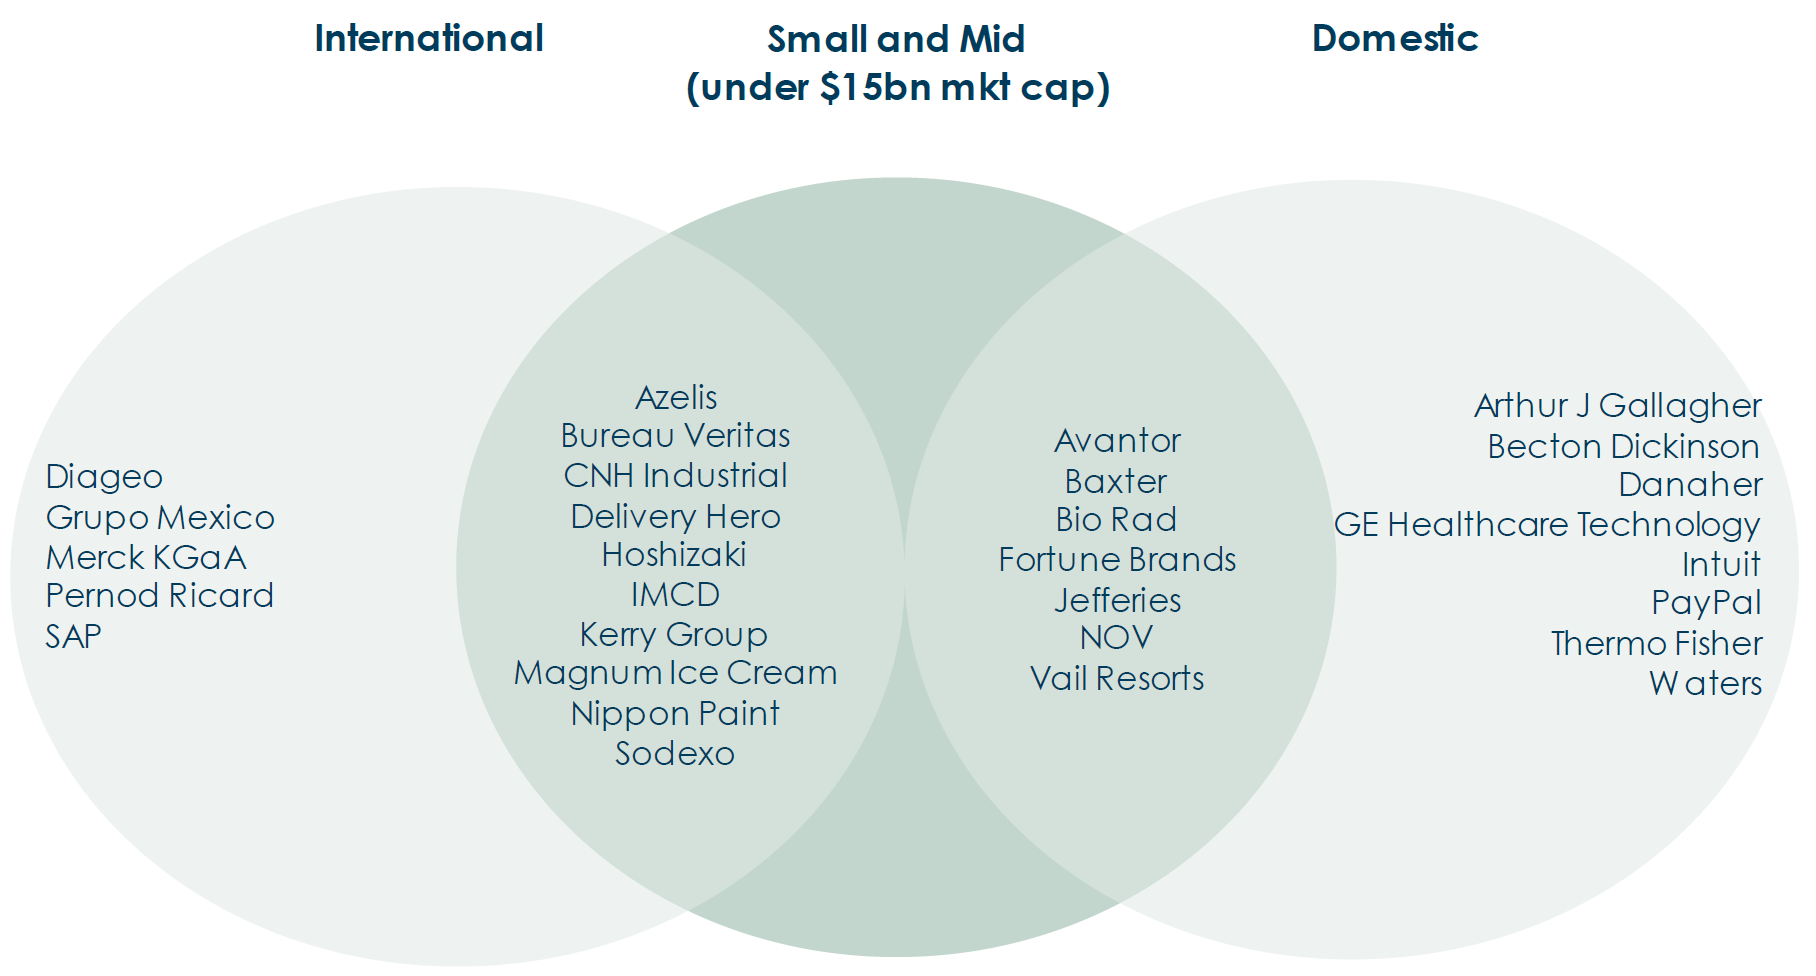
These businesses range from specialty chemical distribution to biotech equipment and were generally purchased at 10-15x our estimate on NTM earnings. While significantly smaller than the index leaders, our recent purchases are industry leaders, with strong balance sheets and attractive growth profiles.
In fact, we believe the generic profile of our portfolio has improved – faster growth and reasonable valuation.
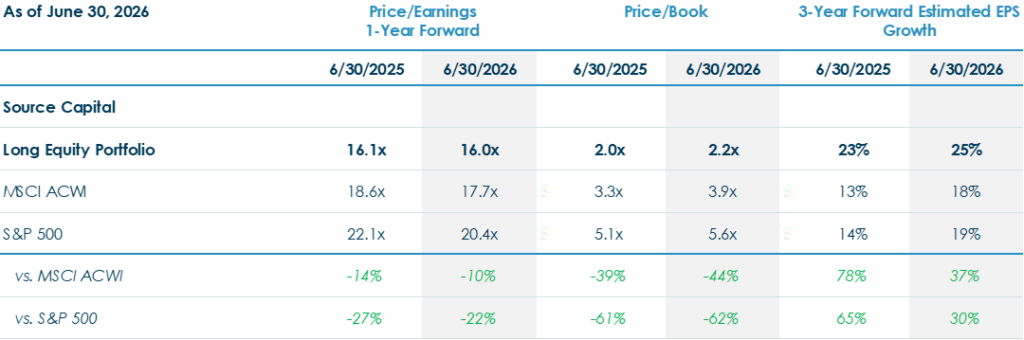
In our view, a portfolio of the companies in the Venn diagram (at our basis) we believe is likely to produce sound returns. This is the type of portfolio we are always striving to create: a diversified mix of high-quality businesses, with good management, purchased at valuation math based on conservative assumptions that should support competitive performance over the long term.
These holdings are primarily mid-cap businesses that look nothing like the index. We are willing to look foolish relative to others and to miss out on the bullish scenarios for AI in order to own a portfolio that we believe is highly likely to result in an acceptable absolute result.
Being out of step is nothing new. You may remember the healthcare/biotech boom that took place in 2020 and 2021. At the time, we had taken our exposure to zero – down from our largest exposure at the time of Obamacare concerns in the early 2010s (in the reference strategy, FPA Contrarian Value). We recall being asked repeatedly whether we understood that there was an exciting future in biotech and cell and gene therapy.
In fact, we were excited, but just not at the prices available at the time. We continued to research the sector and developed a view towards a number of businesses we’d like to own. In the past year we have bought many of those very same businesses at valuations less than half the prevailing rate in 2020/21, and we submit that the future is just as bright and perhaps enhanced by potential AI innovation. Willingness to ignore investments with terrific momentum at valuations and long-term fundamentals that ask difficult questions (Will Covid spending be sustainable? Are these new multiples reflective of fundamentally different businesses?), combined with actively deploying capital when fundamentals and valuation are supportive of equity-like returns, will always be our preferred approach. However, we accept the risk of looking foolish at times and humbly settle for reasonable absolute returns when parts of the market are delivering spectacular returns based on thinking that we don’t quite understand.
In short, we are seldom more bullish than the bulls. Though when analysis and consideration support the position, we are happy to be less bearish than the bears, which we believe should continue to help us generate returns that are attractive on an absolute basis and not risk taking the Fund (and you) off a cliff.
16 Epoch AI. As of 1 June 2026. https://epoch.ai/data/ai-companies?view=graph&tab=revenue.
17 Source: Benedict Evans. As of May 2026. https://static1.squarespace.com/static/50363cf324ac8e905e7df861/t/6a14a48160477b0e9a99301f/1779737729030/2026-Spring-AI.pdf. Aggregate benchmark score is a single composite metric or skill rating that combines results from multiple standardized tests (such as MMLU, coding suites, and math evaluations) to summarize the peak capabilities of the most advanced large language models (“LLMs”).
18 Source: Artificial Analysis. https://x.com/randgroup/status/2061052319756914815. This chart shows that the cost of the language models has declined substantially from their release dates.
19 Fortune. Without data centers, GDP growth was 0.1% in the first half of 2025, Harvard economist says. Nick Lichtenberg. October 7, 2025. https://fortune.com/2025/10/07/data-centers-gdp-growth-zero-first-half-2025-jason-furman-harvard-economist/.
20 Epoch AI. The AI Boom has doubled computing infrastructure’s share of US GDP. Isabel Juniewiicz. June 5, 2026. https://epoch.ai/data-insights/ai-datacenter-share-gdp.
21 LinkedIn – Alvin Foo, Epoch AI. https://www.linkedin.com/posts/alvinfsc_mind-blowing-scale-of-the-ai-buildout-activity-7451479823744671744-parg. AI capex = estimated data-center share of global reported capex at the big-5 US hyperscalers (Amazon, Microsoft, Alphabet, Meta, Oracle; Epoch AI + Platformonomics). Assuming DC share scales from ~55% in 2020 to ~80% by 2026. Excludes Chinese hyperscalers. All costs in 2024 dollars.
22 Source: LinkedIn – Benjamin Todd. https://www.linkedin.com/posts/benjamin-j-todd_the-ai-boom-is-still-small-compared-to-other-activity-7451048553445052416-h7sv. The chart shows each year’s capital expenditure (capex) divided by that year’s nominal world GDP, then summed. Note: World GDP figures for the 19th century are estimates derived from Maddison Project Database and US GDP / US-share-of-world-economy benchmarks. Confidence bands on the chart reflect capex uncertainty only.
23 CIO Dive. Global AI spend to reach $2.59 trillion in 2026. May 19, 2026. Paige Gross. https://www.ciodive.com/news/global-AI-spend-2026/820656/.
24 As of June 30, 2026. It should not be assumed that an investment in the securities listed was or will be profitable. The Venn Diagram shows stocks added to the portfolio since 01/01/2024. Please visit our website for a full list of current holdings as of 6/30/2026. https://fpa.com/wp-content/uploads/Source-Capital-Holdings-2026-06.pdf.
Past performance is no guarantee, nor is it indicative, of future results.
Fixed Income
Traditional
Risk-free rates remain high, but the price of credit risk appears very expensive. That led us to own little credit risk.
Spread measures the compensation that debt investors receive for an uncertain return profile. Treasuries are considered the “risk-free” asset because the market views it as a certainty (or near certainty) that Treasuries will be repaid in full at maturity with no possibility of prepayment, extension of payment, or haircut to the amount owed (at least in nominal terms). In comparison, most everything else with a similar expected maturity bears a higher yield than Treasuries because other types of debt may be repaid early, late, or not at all, and that difference in yield versus Treasuries is the spread.
A big driver of whether and when debt is repaid (in addition to call or extension features) is the credit quality of the borrower. Viewed through that lens, spread can be seen as the compensation that debt investors receive for taking on credit risk – the risk that a borrower will not repay debt in full and/or by maturity. Over the past few months, spreads have decreased into historically low territory. In other words, the compensation for credit risk has decreased into historically low territory.
The chart and table below show yields and spreads on the Bloomberg U.S. Corporate High Yield Index and the BB component of that index, excluding energy. The latter is a measure of the high yield market that we believe provides a more consistent price comparison over time due to changes in the composition of the high yield market. Spreads in the high yield market ended the quarter at the fourth percentile (a lower percentile indicates a more expensive market, i.e., the compensation for credit risk is low). Said another way, historically 96% of the time spreads have been higher than they were at June 30.
Bloomberg U.S. Corporate High-Yield and BB ex. Energy Index Yield-To-Worst (YTW) and Spread25
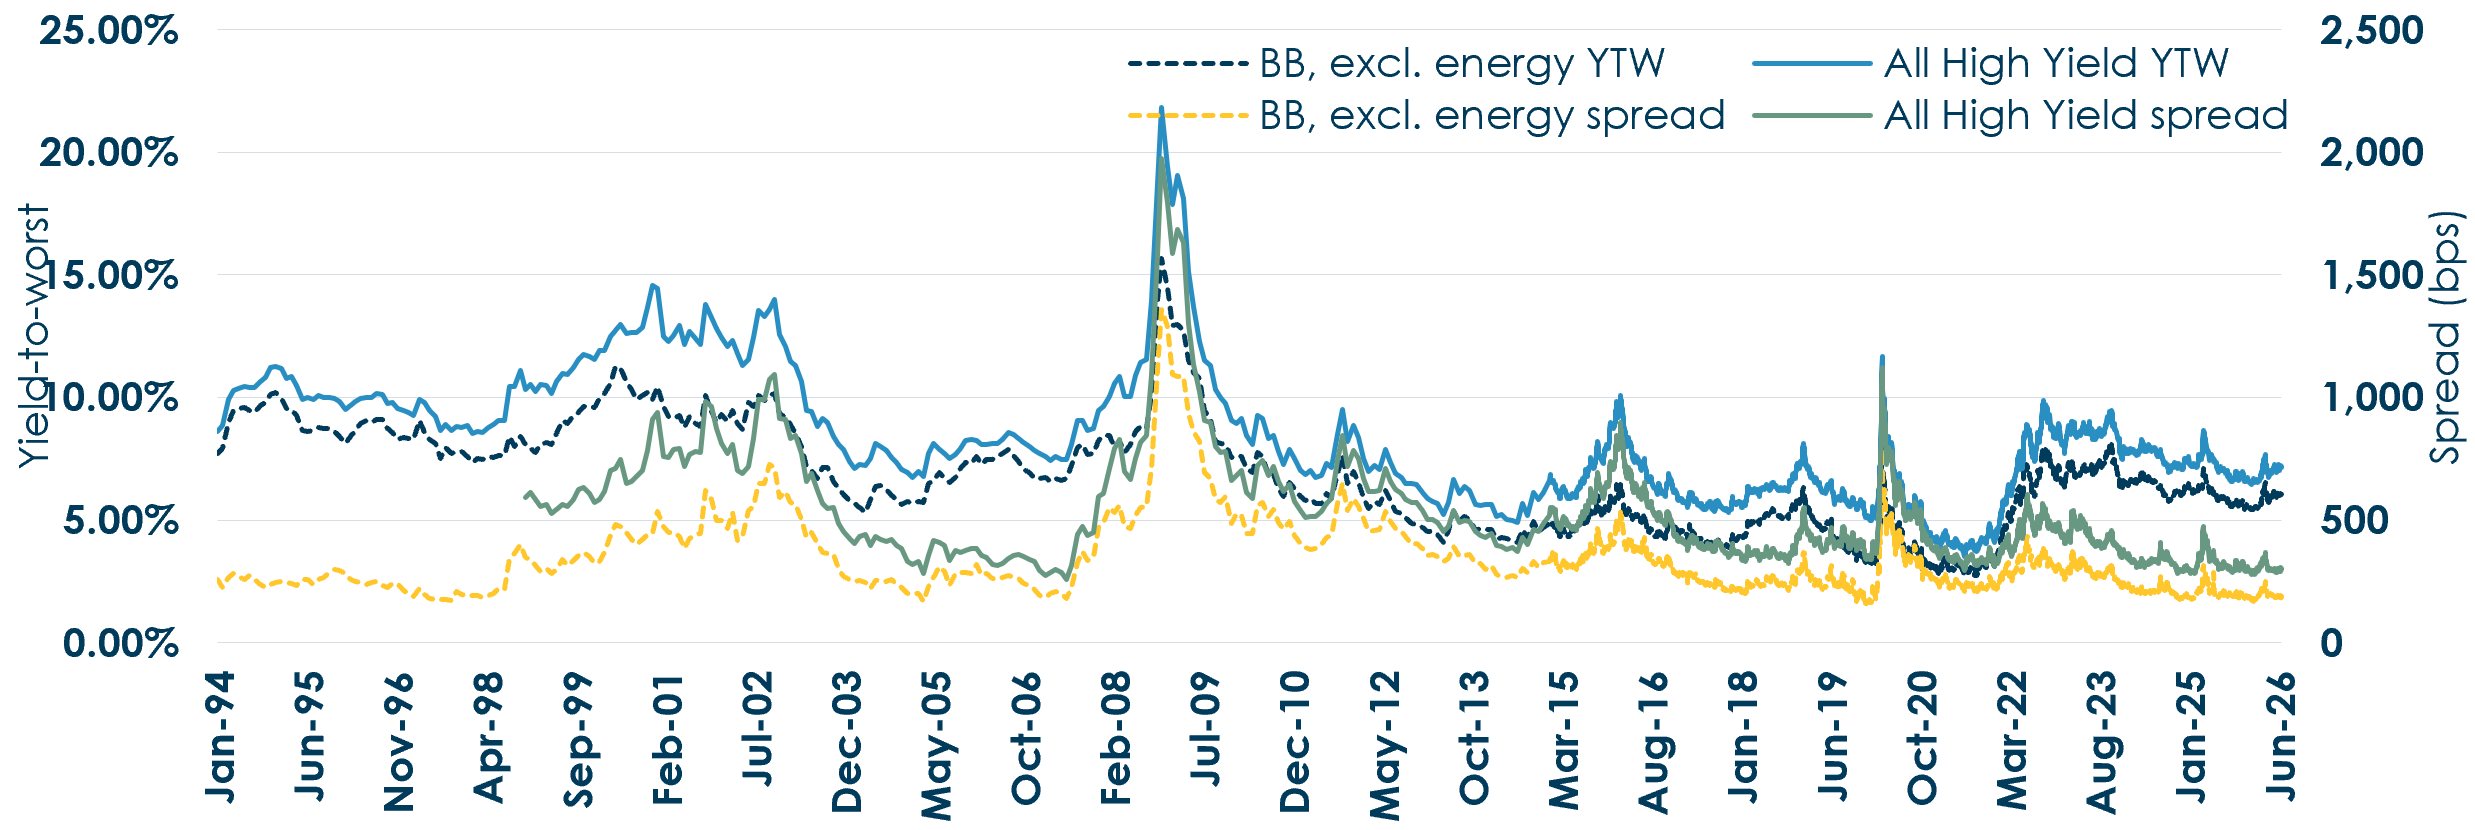

The market is priced as if nothing could go wrong. We have concerns, but even if we didn’t, at historically low spreads, are we getting paid to find out that things are not going well? We do not think so. Due to such low spreads, when evaluating individual investment opportunities, more often than not we find that the compensation for credit risk is inadequate. Further, we believe that low spreads increase the likelihood and magnitude of a potential short-term drawdown related to an increase in spreads.
To be clear, we are not categorically waving off everything with a high yield rating. We make our decisions at the individual investment level. Repeating those decisions led us to low Credit exposure at the portfolio level. Some may not find this positioning exciting. We do. We are excited about not owning a portfolio laden with overpriced credit risk.
Lastly, our look through software-related exposure is 2.3% of the overall fund and we are not concerned about this exposure from an overall portfolio exposure or the credit quality of the individual bonds.
Private Credit
Source has 26.0% committed to private credit (including called and uncalled capital) as of quarter-end. We continue to look for opportunities to increase that exposure.
On the private side, our look through software-related exposure is approximately 0.3% of the overall fund and we are not concerned about this exposure either from an overall portfolio exposure.
Corporate & Other
Distribution
On July 21, 2026, the Fund’s Board approved maintaining the current rate of 20.83 cents per share for its regular monthly distribution through November 2026.26 This equates to an annualized unlevered distribution rate of 5.44% based on the Fund’s closing market price on June 30, 2026.
Discount to NAV
The Fund’s discount to NAV closed at 7.13% at quarter-end. The average discount to NAV for the trailing twelve months was 4.69%.27
Closing
We are grateful for the trust our investors continue to place in our disciplined approach to capital stewardship.
Respectfully submitted,
Source Capital Portfolio Managers
August 17, 2026
25 Source: Bloomberg. As of June 30, 2026. YTW is Yield-to-Worst. Spread reflects the quoted spread of a bond that is relative to the security off which it is priced, typically an on-the-run Treasury. For illustrative purposes only.
26 For more information related to the Fund’s distribution rate, please see https://fpa.com/insights/?category_name=fund-announcements. Dividends and other distributions are not guaranteed.
27 Source: FPA. The average is calculated using daily discount rates.
Past performance is no guarantee, nor is it indicative, of future results.
Important Information
This Commentary is for informational and discussion purposes only and does not constitute, and should not be construed as, an offer or solicitation for the purchase or sale with respect to any securities, products or services discussed, and neither does it provide investment advice. This Commentary does not constitute an investment management agreement or offering circular.
Current performance information is updated monthly and is available by calling 1-800-982-4372 or by visiting fpa.com. Performance data quoted represents past performance, which is no guarantee of future results. Current performance may vary from the performance quoted. The returns shown for Source Capital are calculated at net asset value per share, including reinvestment of all distributions. Returns do not reflect the deduction of taxes that a shareholder would pay on Fund distributions, which would lower these figures. Since Source Capital is a closed-end investment company and its shares are bought and sold on the New York Stock Exchange, your performance may also vary based upon the market price of the common stock.
The Fund is managed according to its investment strategy which may differ significantly in terms of security holdings, industry weightings, and asset allocation from those of the comparative indices. Overall Fund performance, characteristics and volatility may differ from the comparative indices shown.
There is no guarantee the Fund’s investment objectives will be achieved. You should consider the Fund’s investment objectives, risks, and charges and expenses carefully before you invest. You can obtain additional information by visiting the website at https://fpa.com/fund/source-capital/, by email at [email protected], or toll-free by calling 1-800-279-1241.
Effective January 1, 2025, Source Capital, Inc. was reorganized into a Delaware Trust. The Fund’s new name is Source Capital, but it continues to trade on the NYSE under the SOR ticker. There was no change in its investment objective, investment strategy, or fundamental investment policies. FPA continues to be the adviser to the Fund.
The views expressed herein and any forward-looking statements are highly speculative, current only as of the date of this publication and are those of the portfolio management team. Forward-looking statements can be identified by the use of terms such as “may”, “will”, “should”, “expect”, “anticipate”, “project”, “estimate”, “intend”, “continue” or “believe” (or the negatives thereof) or other variations thereof. Due to various risks and uncertainties, actual events or results or actual performance may differ materially and are subject to change at any time in response to changing circumstances and industry developments. This information and data has been prepared from sources believed reliable, but the accuracy and completeness of the information cannot be guaranteed and is not a complete summary or statement of all available data. FPA does not undertake to update any forward-looking statement because of new information, future developments, or otherwise.
Portfolio composition will change due to ongoing management of the Fund. References to individual financial instruments or sectors are for informational purposes only and should not be construed as recommendations by the Fund or the portfolio managers. It should not be assumed that future investments will be profitable or will equal the performance of the financial instrument or sector examples discussed. The portfolio holdings as of the most recent quarter-end may be obtained at fpa.com.
Investing in closed‐end funds involves risk, including loss of principal. Closed‐end fund shares may frequently trade at a discount (less than) or premium (more than) to their net asset value. If the Fund’s shares trade at a premium to net asset value, there is no assurance that any such premium will be sustained for any period of time and will not decrease, or that the shares will not trade at a discount to net asset value thereafter.
Capital markets are volatile and can decline significantly in response to adverse issuer, political, regulatory, market, or economic developments. It is important to remember that there are risks inherent in any investment and there is no assurance that any investment or asset class will provide positive performance over time.
The Fund may purchase foreign securities, including American Depository Receipts (ADRs) and other depository receipts, which are subject to interest rate, currency exchange rate, economic and political risks; these risks may be heightened when investing in emerging markets. Non‐U.S. investing presents additional risks, such as the potential for adverse political, currency, economic, social or regulatory developments in a country, including lack of liquidity, excessive taxation, and differing legal and accounting standards. Non‐U.S. securities, including American Depository Receipts (ADRs) and other depository receipts, are also subject to interest rate and currency exchange rate risks.
The return of principal in a fund that invests in fixed income instruments is not guaranteed. The Fund’s investments in fixed income instruments have the same issuer, interest rate, inflation and credit risks that are associated with underlying fixed income instruments owned by the Fund. Such investments may be secured, partially secured or unsecured and may be unrated, and whether or not rated, may have speculative characteristics. The market price of the Fund’s fixed income investments will change in response to changes in interest rates and other factors.
Generally, when interest rates go up, the value of fixed income instruments, such as bonds, typically go down (and vice versa) and investors may lose principal value. Credit risk is the risk of loss of principal due to the issuer’s failure to repay a loan. Generally, the lower the quality rating of an instrument, the greater the risk that the issuer will fail to pay interest fully and return principal in a timely manner. If an issuer defaults, the security may lose some or all its value. Lower rated bonds, convertible securities and other types of debt obligations involve greater risks than higher rated bonds.
Mortgage-related and asset-backed securities are subject to prepayment risk, can be highly sensitive to changes in interest rates, and are subject to credit risk/risk of default on the underlying assets. Convertible securities are generally not investment grade and are subject to greater credit risk than higher‐rated investments. High yield securities can be volatile and subject to much higher instances of default. The Fund may experience increased costs, losses and delays in liquidating underlying securities should the seller of a repurchase agreement declare bankruptcy or default.
The ratings agencies that provide ratings are Standard and Poor’s (“S&P”), Fitch, Moody’s, Kroll, DBRS, and any other nationally recognized statistical rating organization (“NRSRO”). Credit ratings range from AAA (highest) to D (lowest). Bonds rated BBB or above are considered investment grade (IG). Credit ratings of BB and below are lower-rated securities (junk bonds). High-yielding, non-investment grade bonds (junk bonds) (HY) involve higher risks than investment grade bonds. Bonds with credit ratings of CCC or below have high default risk.
Private placement securities are securities that are not registered under the federal securities laws and are generally eligible for sale only to certain eligible investors. Private placements may be illiquid, and thus more difficult to sell, because there may be relatively few potential purchasers for such investments, and the sale of such investments may also be restricted under securities laws.
The Fund may use leverage. While the use of leverage may help increase the distribution and return potential of the Fund, it also increases the volatility of the Fund’s net asset value (NAV), and potentially increases volatility of its distributions and market price. There are costs associated with the use of leverage, including ongoing dividend and/or interest expenses. There also may be expenses for issuing or administering leverage. Leverage changes the Fund’s capital structure through the issuance of preferred shares and/or debt, both of which are senior to the common shares in priority of claims. If short-term interest rates rise, the cost of leverage will increase and likely will reduce returns earned by the Fund’s common stockholders.
Value style investing presents the risk that the holdings or securities may never reach their full market value because the market fails to recognize what the portfolio management team considers the true business value or because the portfolio management team has misjudged those values. In addition, value style investing may fall out of favor and underperform growth or other styles of investing during given periods.
Distribution Rate
Distributions may include the net income from dividends and interest earned by fund securities, net capital gains, or in certain cases it may include a return of capital. The Fund may also pay a special distribution at the end of a calendar year to comply with federal tax requirements. All mutual funds, including closed-end funds, periodically distribute profits they earn to investors. By law, if a fund has net gains from the sale of securities, or if it earns dividends and interest from securities, it must pass substantially all of those earnings to its shareholders or it will be subject to corporate income taxes and excise taxes. These taxes would, in effect, reduce investors’ total return. First Pacific Advisors, LP does not provide legal, accounting, or tax advice.
The Fund’s distribution rate may be affected by numerous factors, including changes in realized and projected market returns, Fund performance, and other factors. There can be no assurance that a change in market conditions or other factors will not result in a change in the Fund’s distribution rate at a future time.
Index Definitions
Comparison to any index is for illustrative purposes only and should not be relied upon as a fully accurate measure of comparison. The Fund may be less diversified than the indices noted herein and may hold non-index securities or securities that are not comparable to those contained in an index. Indices will hold positions that are not within the Fund’s investment strategy. Indices are unmanaged and do not reflect any commissions, transaction costs, or fees and expenses which would be incurred by an investor purchasing the underlying securities and which would reduce the performance in an actual account. You cannot invest directly in an index. The Fund does not include outperformance of any index in its investment objectives.
Bloomberg U.S. Aggregate Bond Index provides a measure of the performance of the US investment grade bonds market, which includes investment grade US Government bonds, investment grade corporate bonds, mortgage pass-through securities and asset-backed securities that are publicly offered for sale in the United States. The securities in the Index must have at least 1-year remaining in maturity. In addition, the securities must be denominated in US dollars and must be fixed rate, nonconvertible, and taxable.
MSCI ACWI NR USD Index (MSCI ACWI) is an unmanaged free float-adjusted market capitalization weighted index that is designed to measure the equity market performance of developed and emerging markets. Net Return (NR) indicates that withholding taxes are applied to dividend reinvestments. MSCI uses the withholding tax rate applicable to non-resident institutional investors that do not benefit from double taxation treaties.
Standard & Poor’s 500 Stock Index (S&P 500) is a capitalization-weighted index which covers industrial, utility, transportation and financial service companies, and represents approximately 75% of the New York Stock Exchange (NYSE) capitalization and 30% of NYSE issues. The S&P 500 is considered a measure of large capitalization stock performance.
60% MSCI ACWI / 40% BBG U.S. Aggregate Bond Index is a hypothetical combination of unmanaged indices and comprises 60% MSCI ACWI Index and 40% Bloomberg U.S. Aggregate Bond Index.
60% S&P500 / 40% BBG U.S. Aggregate Bond Index is a hypothetical combination of unmanaged indices and comprises 60% S&P 500 Index and 40% Bloomberg U.S. Aggregate Bond Index.
Bloomberg U.S. High Yield Index measures the market of USD-denominated, non-investment grade, fixed-rate, taxable corporate bonds.
Bloomberg U.S. High Yield BB ex Energy Index measures the market of USD-denominated, non-investment grade, fixed-rate, taxable BB-rated corporate bonds excluding energy sector.
Glossary of Terms
Capital expenditures (CapEx) are the funds companies allocate to acquire, upgrade, and maintain essential physical assets like property, technology, or equipment, crucial for expanding operational capacity and securing long-term economic benefits.
Credit is defined as investments rated BBB or lower, including non-rated investments.
Discount to Net Asset Value (NAV) is a pricing situation when a closed-end fund’s market trading price is lower than its daily net asset value (NAV).
Dividend Yield is the dividend per share divided by the price per share.
Equity-like returns refer to long-term returns that are comparable to those generated by equity markets.
Earnings Per Share (EPS) is calculated as a company’s profit divided by the outstanding shares of its common stock.
High-Yield (HY) Bond is a high paying bond with a lower credit rating than investment-grade corporate bonds, Treasury bonds and municipal bonds. Because of the higher risk of default, these bonds pay a higher yield than investment grade bonds.
Investment Grade (IG) is a rating that indicates that a bond has a relatively low risk of default.
Market Capitalization refers to the total dollar market value of a company’s outstanding shares of stock. Commonly referred to as “market cap,” it is calculated by multiplying the total number of a company’s outstanding shares by the current market price of one share.
Market Price is the price at which investors may purchase or sell shares of Source Capital, which is an exchange-traded closed-end fund. Market price is determined in the open market by buyers and sellers, based on supply and demand. The difference between the market price and the NAV (Premium/Discount) is expressed as a percentage of NAV.
Net Asset Value (NAV) is the market value of one share of the Fund. The NAV is calculated by subtracting the Fund’s liabilities from the value of the Fund’s total assets and dividing it by the number of the Fund’s outstanding shares.
On-the-run Treasuries are the most recently issued U.S. Treasury bonds, notes, or bills of a specific maturity and can serve as benchmarks for pricing other financial instruments.
Price/Earnings Ratio (P/E) is the price of a stock divided by its earnings per share. P/E is using weighted harmonic averaging, which helps avoid extreme results that may occur due to small relative numbers, and excludes Real Estate Investment Trusts (REITs). 12-Month Trailing P/E is based on the last 12 months of actual earnings. 12-Month Forward P/E utilizes forward earnings expectations over the next 12 months to calculate the ratio.
Risk-free rate of return is the theoretical rate of return of an investment with zero risk. The risk-free rate represents the interest an investor would expect from an absolutely risk-free investment over a specified period of time.
Spread reflects the quoted spread of a bond that is relative to the security off which it is priced, typically an on-the-run treasury.
Yield is the discount rate that links the bond’s cash flows to its current dollar price.
Yield to Worst (YTW) is presented gross of fees and reflects the lowest potential yield that can be received on a debt investment without the issuer defaulting. YTW considers the impact of expected prepayments, calls and/or sinking funds, among other things. Average YTW is based on the weighted average YTW of the investments held in the Fund’s portfolio. YTW is only one component of return and may not represent the yield an investor should expect to receive. YTW excludes convertible bonds with a YTW less than the comparable maturity Treasury yield plus the 20-Year average high yield spread to the Treasury yield, impaired/defaulted bonds, and letters of credit. The indices’ YTWs exclude all convertibles.
©2026 Morningstar, Inc. All Rights Reserved. The information contained herein: (1) is proprietary to Morningstar and/or its content providers; (2) may not be copied or distributed; and (3) is not warranted by Morningstar to be accurate, complete, or timely. Neither Morningstar nor its content providers are responsible for any damages or losses arising from any use of this information. Past performance is no guarantee, nor is it indicative, of future results.