
You should consider the Fund’s investment objectives, risks, and charges and expenses carefully before you invest. The Prospectus details the Fund’s objective and policies, charges, and other matters of interest to a prospective investor. Please read the Prospectus carefully before investing. The Prospectus may be obtained by visiting the website at fpa.com, by email at [email protected], toll-free by calling 1-800-982-4372 or by contacting the Fund in writing.
Average Annual Total Returns (%)

Index data source: Morningstar.
Past performance is no guarantee of future results and current performance may be higher or lower than the performance shown. This data represents past performance and investors should understand that investment returns and principal values fluctuate, so that when you redeem your investment it may be worth more or less than its original cost. Current month-end performance data, which may be lower or higher than the performance data quoted, may be obtained at fpa.com or by calling toll-free, 1-800-982-4372.
The FPA Queens Road Value Fund (“Fund”) commenced operations on June 13, 2002. Periods greater than one year are annualized. Fund performance is shown net of all fees and expenses and includes reinvestment of all distributions. Fund performance does not reflect the deduction of taxes that a shareholder would pay on Fund distributions or the redemption of Fund shares, which would lower these figures. An investor cannot invest directly in an index.
*Prior to November 1, 2020, the performance shown reflects the historical performance of the Fund when Bragg Financial Advisors, Inc. (“BFA”) served as investment adviser of the Fund.
From inception of the Fund to December 31, 2004, BFA and its affiliates voluntarily absorbed certain expenses of the Fund and voluntarily waived its management fee. Had BFA not done this, returns would have been lower during that period. Effective January 1, 2005 through October 31, 2020, BFA had a unitized fee structure that limited operating expenses to 0.95%.
The Fund’s Total Annual Operating Expenses (as of the most recent prospectus) before reimbursement are 1.36%. The adviser has contractually agreed to waive management fees and reimburse the Fund for operating expenses in excess of 0.73% of average daily net assets of the Fund, excluding interest, taxes, brokerage fees and commissions payable by the Fund in connection with the purchase or sale of portfolio securities, fees and expenses of other funds in which the Fund invests, and extraordinary expenses, including litigation expenses not incurred in the Fund’s ordinary course of business, until September 30, 2026. These fee waivers and expense reimbursements are subject to possible recoupment by the adviser from the Fund in future years (within the three years from the date when the amount is waived or reimbursed) if such recoupment can be achieved within the lesser of the foregoing expense limits or the then-current expense limits. Similarly, the adviser is permitted to seek reimbursement from the Fund, subject to certain limitations, of fees waived or payments made by adviser to the Predecessor Fund (defined below) prior to the Predecessor Fund’s reorganization on July 28, 2023, for a period ending three years after the date of the waiver or payment. This agreement may be terminated only by the Fund’s Board of Trustees, upon written notice to the adviser.
Please see important disclosures at the end of the commentary.
Dear Fellow Shareholder:
FPA Queens Road Value Fund returned 14.46% for the second quarter of 2026. This compares to the S&P 500 Value Index return of 8.00% for the same period. Year to date, the Fund returned 11.18% while the Index returned 8.03%.
Corporate earnings were strong, although the headline figures overstated the breadth of the growth. Blended second-quarter earnings growth for the S&P 500 was 47.4%, but would have been 28.8% excluding Alphabet and Amazon, whose results included substantial non-operating investment gains associated with holdings in SpaceX and Anthropic. Even on that adjusted basis, the quarter marked the seventh consecutive period of double-digit earnings growth for the S&P 500 index.1 Against this backdrop, we continue to focus on the quality and price of the individual businesses we own. The Fund has now been managed through twenty-four years of varied conditions, and our priority remains the long-term stewardship of our shareholders’ capital.
Trailing Twelve Month Top and Bottom Contributors (%)2
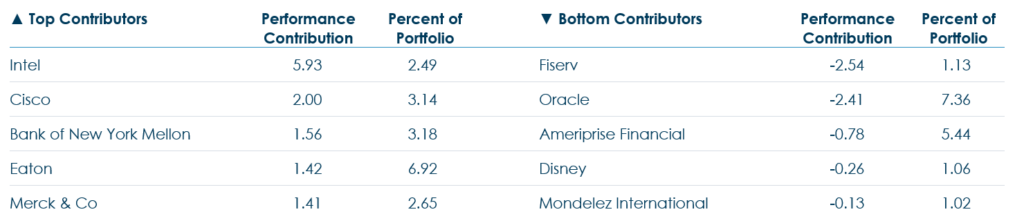
A year ago we wrote that Intel was struggling with a combination of falling behind the cutting edge of technology and a high debt load, and the stock was priced accordingly. This quarter Intel was our largest contributor by a wide margin, adding 4.94% to Fund performance. The improvement has been fundamental as well as sentimental. Intel reported second quarter revenue of $16.1 billion, up 25% year over year and its fastest growth in more than fifteen years, with gross margin expanding to 40.4% from 27.5%. Demand for server processors has been stronger than expected, and the company has moved its 18A manufacturing process into high volume production at its new facility in Arizona. Domestic semiconductor manufacturing has become a matter of national policy, and Intel remains strategically important to the buildout of computing capacity now underway.
Though we did not explicitly forecast this, owning good businesses at good prices, over time, in a careful and diversified way, can produce steady results and occasionally an outsized one like Intel this quarter.
Centene was another significant contributor. In our fourth quarter letter we wrote that Centene faced dual pressure from higher medical costs and lower government reimbursement rates on its large Medicaid book, which is why the shares were cheap. Since then the backdrop for managed care has improved. The cost trends that had been a headwind for the industry are beginning to subside, and rate resets have largely caught up to them. Centene’s health benefits ratio improved to 89.6% from 93.0%, and the company raised its full-year revenue guidance. The larger insurers have reported movement in the same direction.
Beyond Intel and Centene, our top contributors were Cisco, Eaton and Trane. All three have varying degrees of exposure to the buildout of data centers and the electrical infrastructure that supports it, and in each case demand has been strong. Cisco nearly doubled its full-year outlook for artificial intelligence infrastructure orders during the period, from roughly $5 billion to $9 billion, which is representative of the pattern.
Our top detractors for the quarter were Hershey, Pfizer, McDonald’s, RTX and Allegion. Hershey has spent the past two years absorbing historically high input costs, and while those pressures have eased, margin recovery is still working its way through reported results. Consumer staples more broadly have been out of favor, with shoppers trading down and health-related shifts in eating habits weighing on packaged food volumes. Pfizer raised the midpoint of its full-year revenue guidance by $500 million on stronger non-COVID product sales while lowering its expectation for COVID-related revenue, and the market remains focused on what replaces those franchises. McDonald’s grew global comparable sales 1.3% and U.S. comparable sales 0.8%, with guest counts down and management pointing largely at its own execution. A large share of McDonald’s U.S. customer base is absorbing higher food and fuel costs.
We are focused on the long-term fundamental performance of the businesses we own rather than short-term market trends, and we avoid predictions about narrow market direction. We will continue to manage the portfolio with diligence, discipline and patience.
We appreciate your trust in us to be good stewards of your capital. If you would like to discuss performance or the Fund’s holdings in greater detail, please let us know.
Respectfully,
Steve Scruggs, CFA
Portfolio Manager
1 FactSet, “Earnings Insight,” July 31, 2026. https://insight.factset.com/sp-500-earnings-season-update-july-31-2026
2 Reflects the top contributors and top detractors to the Fund’s performance based on preliminary contribution to return for the trailing twelve months (TTM) period ending June 30, 2026. Contribution is presented gross of investment management fees, transactions costs, and Fund operating expenses, which if included, would reduce the returns presented. Portfolio weights represent the average weights over the periods noted. A copy of the methodology used and a list of every holding’s contribution to the overall Fund’s performance during the quarter to date (QTD) and year to date (YTD) is available by contacting [email protected]. It should not be assumed that recommendations made in the future will be profitable or will equal the performance of the securities listed. Totals may not sum due to rounding. Note: June 30, 2026 company descriptions were developed by the investment team and unless otherwise noted reflect the most recent data made available by the companies or third-party research firms the investment team believe to be reliable.
Important Information
This Commentary is for informational and discussion purposes only and does not constitute, and should not be construed as, an offer or solicitation for the purchase or sale of any securities, products or services discussed, and neither does it provide investment advice. Any such offer or solicitation shall only be made pursuant to the Fund’s Prospectus, which supersedes the information contained herein in its entirety. This Commentary does not constitute an investment management agreement or offering circular.
The statements contained herein reflect the opinions and views of the portfolio manager as of the date written, is subject to change without notice, and may be forward-looking and/or based on current expectations, projections, and/or information currently available. Such information may not be accurate over the long-term. These views may differ from other portfolio managers and analysts of the firm as a whole and are not intended to be a forecast of future events, a guarantee of future results or investment advice.
Portfolio composition will change due to ongoing management of the Fund. References to individual securities or sectors are for informational purposes only and should not be construed as recommendations by the Fund, the portfolio manager, the Adviser, the Sub-Adviser or the distributor. It should not be assumed that future investments will be profitable or will equal the performance of the security or sector examples discussed. The portfolio holdings as of the most recent quarter-end may be obtained at fpa.com.
Future events or results may vary significantly from those expressed and are subject to change at any time in response to changing circumstances and industry developments. The information and data contained herein has been prepared from sources believed reliable, but the accuracy and completeness of the information cannot be guaranteed and is not a complete summary or statement of all available data.
The information contained herein is not complete, may change, and is subject to, and is qualified in its entirety by, the more complete disclosures, risk factors, and other information contained in the Fund’s Prospectus and Statement of Additional Information. The information is furnished as of the date shown. No representation is made with respect to its completeness or timeliness. The information is not intended to be, nor shall it be construed as, investment advice or a recommendation of any kind.
Certain statements contained in this presentation may be forward-looking and/or based on current expectations, projections, and information currently available. Actual events or results may differ from materially those we anticipate, or the actual performance of any investments described herein may differ from those reflected or contemplated in such forward-looking statements, due to various risks and uncertainties. We cannot assure future results and disclaim any obligation to update or alter any forward-looking statements, whether as a result of new information, future events, or otherwise. Such statements may or may not be accurate over the long term. Statistical data or references thereto were taken from sources which we deem to be reliable, but their accuracy cannot be guaranteed.
The reader is advised that the Fund’s investment strategy includes active management with corresponding changes in allocations from one period of time to the next. Therefore, any data with respect to investment allocations as of a given date is of limited use and may not be reflective of the portfolio manager’s more general views with respect to proper geographic, instrument and /or sector allocations. The data is presented for indicative purposes only and, as a result, may not be relied upon for any purposes whatsoever.
In making any investment decision, you must rely on your own examination of the Fund, including the risks involved in an investment. Investments mentioned herein may not be suitable for all recipients and in each case, potential investors are advised not to make any investment decision unless they have taken independent advice from an appropriately authorized advisor. An investment in any security mentioned herein does not guarantee a positive return as securities are subject to market risks, including the potential loss of principal. You should not construe the contents of this document as legal, tax, investment or other advice or recommendations.
Fund performance presented is calculated on a total return basis, which includes the reinvestment of all income, plus realized and unrealized gains/losses, if applicable. Unless otherwise indicated, performance results are presented on a net of fees basis and reflect the deduction of, among other things: management fees, brokerage commissions, operating and administrative expenses, and accrued performance fee/allocation, if applicable.
The information provided in this presentation is based upon data existing as of the date(s) of the report and has not been audited or reviewed. While we believe the information to be accurate, it is subject in all respects to adjustments that may be made after proper review and reconciliation.
Investments carry risks and investors may lose principal value. Capital markets are volatile and can decline significantly in response to adverse issuer, political, regulatory, market, or economic developments. Small and mid-cap stocks involve greater risks and they can fluctuate in price more than larger company stocks. You risk paying more for a security than you received from its sale. Groups of stocks, such as value and growth, go in and out of favor which may cause certain funds to underperform other equity funds. The value of an individual security can be more volatile than the market as a whole and can perform differently than the value of the market as a whole.
The prices of securities held by the Fund may decline in response to certain events taking place around the world, including those directly involving the companies whose securities are owned by the Fund. Securities in the Fund’s portfolio may underperform due to inflation (or expectations for inflation), interest rates, global demand for particular products or resources, natural disasters, pandemics, epidemics, terrorism, regulatory events and governmental or quasi-governmental actions. There is a risk that you may lose money by investing in the Fund.
Value style investing presents the risk that the holdings or securities may never reach their full market value because the market fails to recognize what the portfolio management team considers the true business value or because the portfolio management team has misjudged those values. In addition, value style investing may fall out of favor and underperform growth or other styles of investing during given periods.
Please refer to the Fund’s Prospectus for a complete overview of the primary risks associated with the Fund.
©2026 Morningstar, Inc. All Rights Reserved. The Morningstar information contained herein: (1) is proprietary to Morningstar and/or its content providers; (2) may not be copied or distributed; and (3) is not warranted by Morningstar to be accurate, complete, or timely. Neither Morningstar nor its content providers are responsible for any damages or losses arising from any use of this information. Past performance is no guarantee of future results.
The FPA Funds are distributed by Distribution Services, LLC. 190 Middle Street, Suite 301, Portland, ME 04101. Distribution Services, LLC and FPA are not affiliated.
Index Definitions
The Fund will typically be less diversified than the indices noted herein and may hold non-index securities or securities that are not comparable to those contained in an index. Indices will hold positions that are not within the Fund’s investment strategy. Indices are unmanaged and do not reflect any commissions, transaction costs, or fees and expenses which would be incurred by an investor purchasing the underlying securities and which would reduce the performance in an actual account. You cannot invest directly in an index
Standard & Poor’s 500 Stock Index (S&P 500) is a capitalization-weighted index which covers industrial, utility, transportation and financial service companies, and represents approximately 75% of the New York Stock Exchange (NYSE) capitalization and 30% of NYSE issues. The S&P 500 is considered a measure of large capitalization stock performance.
The S&P 500 Value Index is a subset of the S&P 500 index. Companies within the index are ranked based on growth and value factors including three-year change in earnings price/share, three-year sales/share growth rate, momentum, book value/price ratio, earnings/price ratio, sales/price ratio. The companies at the bottom of this list, that have a higher Value Rank, comprising 33% of the total index market capitalization are designated as the Value basket.
Glossary of Terms
Blended earnings growth represents the year-over-year earnings growth rate calculated using a combination of actual reported earnings for companies that have released results and consensus analyst earnings estimates for companies that have not yet reported.