
You should consider the Fund’s investment objectives, risks, and charges and expenses carefully before you invest. The Prospectus details the Fund’s objective and policies, charges, and other matters of interest to a prospective investor. Please read the Prospectus carefully before investing. The Prospectus may be obtained by visiting the website at fpa.com, by email at [email protected], toll-free by calling 1-800-982-4372 or by contacting the Fund in writing.
Average Annual Total Return (%)
| As of September 30, 2025 | Since Inception | 20 Year | 15 Year | 10 Year | 5 Year | 3 Year | 1 Year | YTD | QTD |
|---|---|---|---|---|---|---|---|---|---|
| FPA Queens Road Small Cap Value (QRSVX) | 9.76 | 8.22 | 9.66 | 10.34 | 15.33 | 18.02 | 16.48 | 13.77 | 7.46 |
| Russell 2000 Value | 8.31 | 7.27 | 9.54 | 9.23 | 14.59 | 13.56 | 7.88 | 9.04 | 12.60 |
Index data source: Morningstar
Past performance is no guarantee, nor is it indicative, of future results. Current performance may be higher or lower than the performance shown. This data represents past performance and investors should understand that investment returns and principal values fluctuate, so that when you redeem your investment it may be worth more or less than its original cost. Current month-end performance data, which may be lower or higher than the performance data quoted, may be obtained at fpa.com or by calling toll-free, 1-800-982-4372. The Fund’s Total Annual Operating Expenses are 0.94% (Investor Class), 0.88% (Advisor Class), and 0.80% (Institutional Class).
The FPA Queens Road Small Cap Value Fund (“Fund”) commenced operations on June 13, 2002 (Inception date). Fund performance shown is for the Investor Class shares (QRSVX). Periods greater than one year are annualized. Fund performance is shown net of all fees and expenses and includes reinvestment of all distributions. Fund performance does not reflect the deduction of taxes that a shareholder would pay on Fund distributions or the redemption of Fund shares, which would lower these figures. An investor cannot invest directly in an index.
Prior to November 1, 2020, the performance shown reflects the historical performance of the Fund when Bragg Financial Advisors, Inc. (“BFA”) served as investment adviser of the Fund.
From inception of the Fund to December 31, 2004, BFA and its affiliates voluntarily absorbed certain expenses of the Fund and voluntarily waived its management fee. Had BFA not done this, returns would have been lower during that period. Effective January 1, 2005 through October 31, 2020, BFA charged a single unitary management fee and contractually agreed to pay all operating expenses of the Fund except for brokerage, taxes, interest, litigation expenses, and other extraordinary expenses. Prior to November 1, 2020, the Fund had a unitized fee structure that limited annual operating expenses to 1.18%.
Please see additional important disclosures at the end of this Commentary.
Dear Fellow Shareholder:
The FPA Queens Road Small-cap Value Fund (“Fund”) returned 7.46% in the third quarter of 2025 vs. 12.60% for the Russell 2000 Value Index (“R2KV”). For the first three quarters of 2025, the Fund has returned 13.77% vs. 9.04% for the R2KV.
As a reminder, we expect to outperform in down markets and trail in speculative markets as a result of our diligent, disciplined, and patient process.
20% or Larger Russell 2000 Value Drawdowns Since Fund Inception (%)1
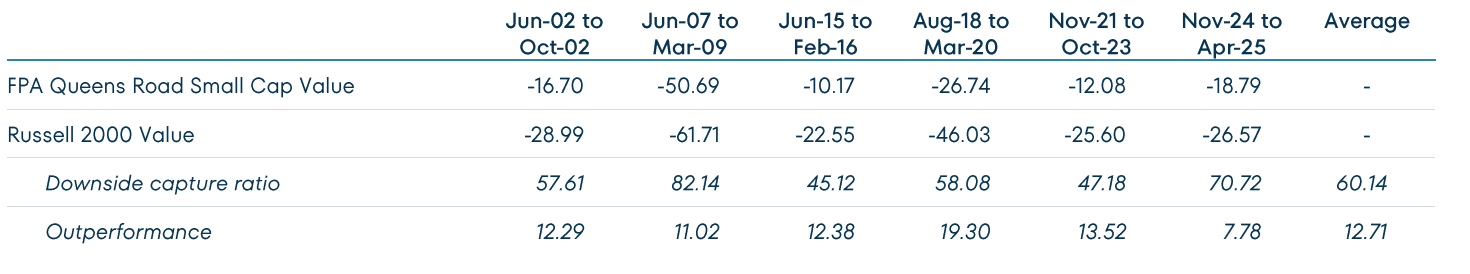
We are pleased with the Fund’s performance year to date. Most importantly, the Fund has performed as expected. It outperformed in Q1 when small-caps were down. And it continued to outperform in April and May during the tariff selloff when stocks were volatile and we were able to put cash to work at attractive prices. Then, the Fund gave back some relative performance in Q3 in a strong market led by more-speculative and lower-quality stocks.
We believe this performance profile is the direct result of our process. A disciplined focus on quality companies that can weather hard times seeks to protect the portfolio when downturns arrive. We are not market timers. And so we give up on fully participating when the outlook is rosy and investors are focused on pie-in-the-sky outcomes. We are conservative by nature and this is a price we are willing to pay.
We follow a four pillar process and are disciplined in applying it to every investment we make. To reiterate quickly: 1) strong balance sheets give companies the ability to weather downturns or mistakes and invest during moments of dislocation; 2) valuation discipline means that our stocks hold up better when disappointing things happen and investor expectations come down; 3) strong management teams, with verifiable track records of success, can be counted on to navigate choppy waters; and 4) focusing on growing industries with stable competitive dynamics gives us the best economic backdrop to succeed. We try to avoid value traps where the price is cheap but fundamentals are deteriorating and negative surprises are more likely.
If those four pillars are in place, we have a quality “compounder” that can grow in value over the long term — and we expect the financials to reflect this quality. The two most important financial metrics we focus on are steady operating margins and high returns on capital. Logically, a company that can earn steadily and make efficient use of its capital base — where they won’t get into trouble because of a bad balance sheet and management can be counted on to reinvest wisely — can’t help but compound value over time. It’s never easy and there are always surprises. But this is what quality means to us, and we believe that the disciplined application of our process has resulted in the performance profile discussed above.
However, while our process is straightforward, it is not mechanical. Each of the four pillars requires significant judgment, nuance and context. Company financials require normalization for cyclicality, accounting treatment, business context, and unusual events. It’s a process, not a formula. We routinely pass over companies that tell a good story but whose financials don’t indicate quality. And we also discard companies with great historical financials when we have questions about their business models, managements, or industry structures. For example, we run a dashboard that sorts our investment universe based on earnings consistency and returns on capital. Currently, specialty financials and banks are gravitating to the top of that list. But we know these companies haven’t experienced a credit cycle in the historical data, so their futures can’t possibly look as good as their pasts.
All of this to is say we have a disciplined process but are not quantitative investors. And so it seems reasonable to us when our results differ from the quantitatively applied quality factor. We are a little bit out of our depth when talking about quantitative or factor investing. And, from talking to friends and briefly perusing the literature, it is our understanding that there is still some debate about exactly what the quality factor is or is not.
According to Research Affiliates, profitability, accounting quality, payout/dilution, and investment are the quality-oriented factors that have premia associated with them.2 But most of the quality premia are associated with profitability and investment, which are included in Fama – French’s five factor model.3 This is obviously very different than the way we view quality, as discussed above. Other practitioners view quality based on some of the things we look for. For example, Morningstar’s quality factor definition is based 50% return on equity and 50% debt to capital.4 But this is a narrow set of criteria applied in a broadly diversified way without additional context. So again, very different from how we invest.
We define quality in a way that, we believe, is intuitive and makes sense. We do it from the bottom up, looking for individual companies that should survive and thrive when times get rocky. And our performance often doesn’t correlate to the quantitatively-applied quality factor which may or may not offer low downside participation.
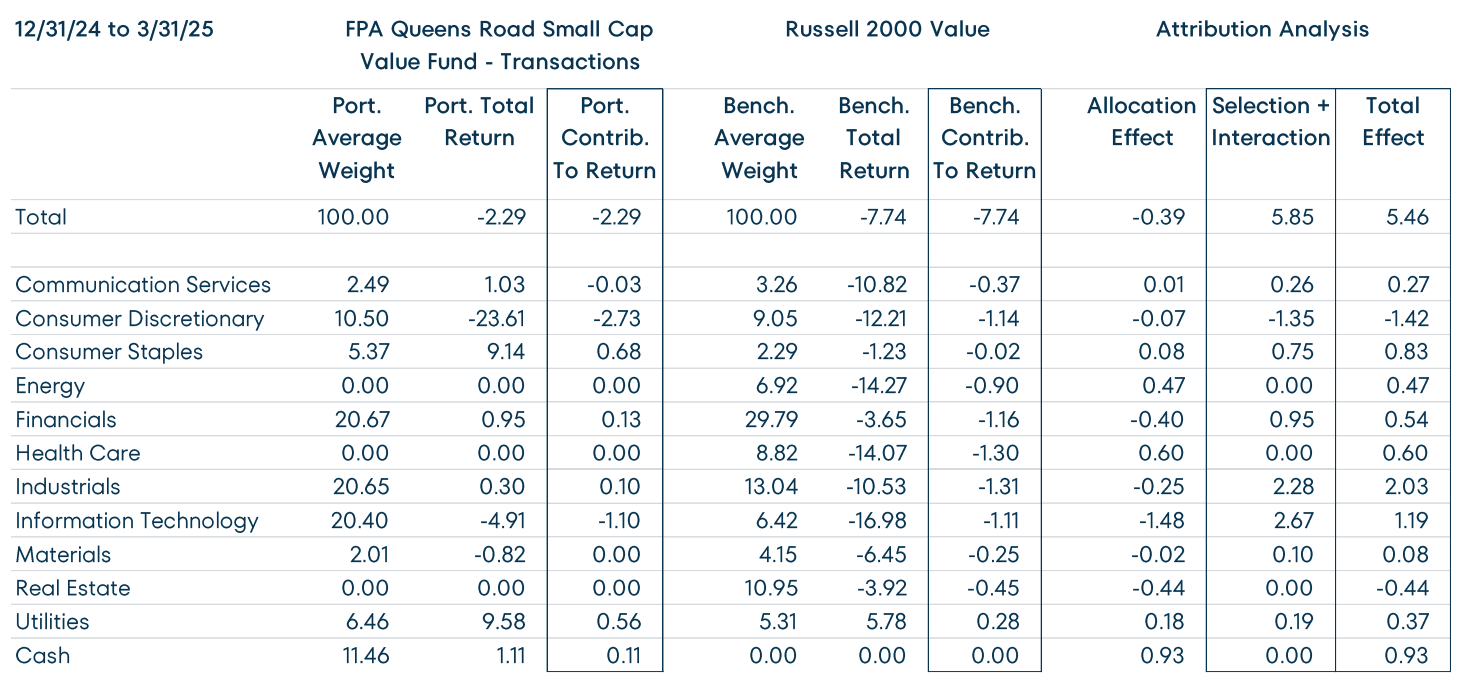
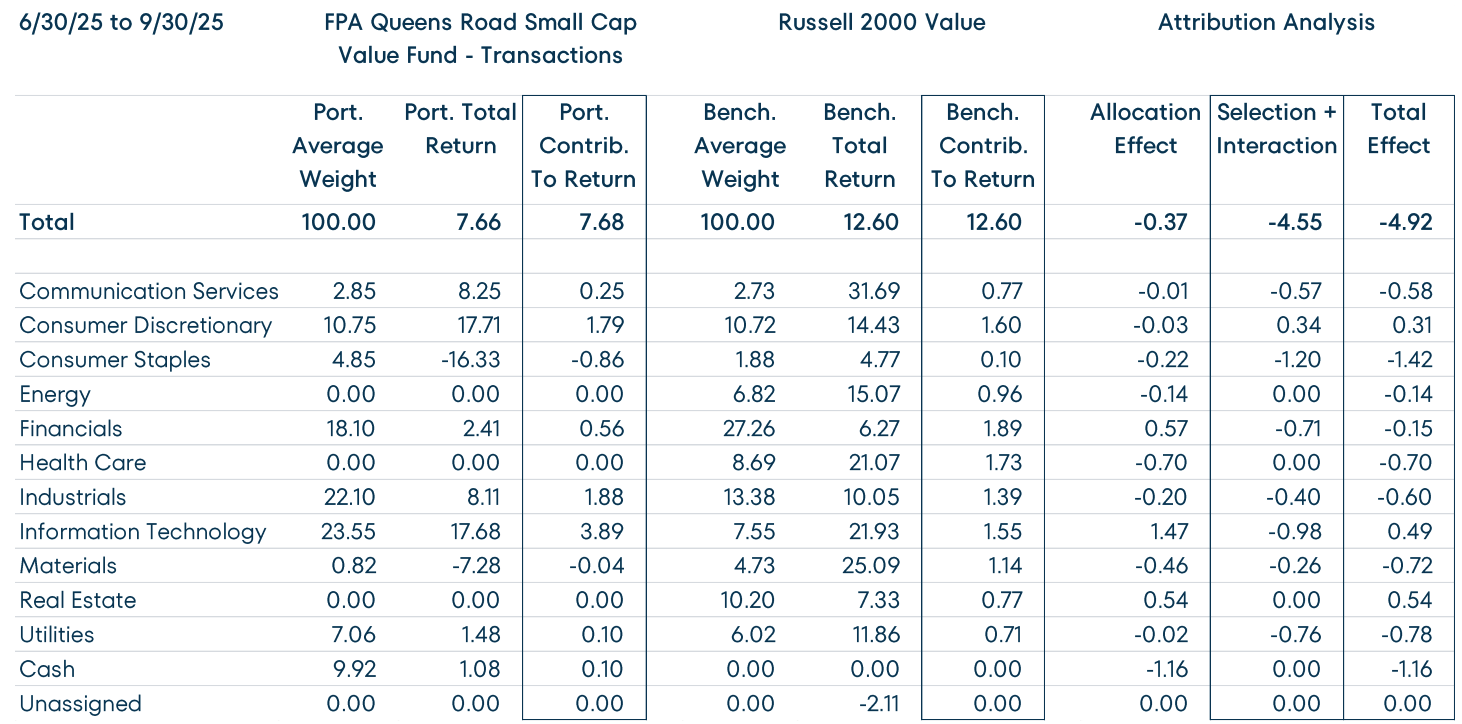
Let’s take a look at this year, in particular Q1 when we outperformed in a down market and Q3 when we trailed in a strong market. (We sidestep Q2, when the Fund performed well, but the quarter had a mix of market regimes).
On a sectoral basis, our outperformance in Q1 and underperformance in Q3 was well diversified. And, almost all of the Fund’s performance was attributable to security selection rather than sector bets.5 This is consistent with the Fund’s performance over longer timeframes when stock selection has driven our returns.
1 As of September 30, 2025. Source: Morningstar Direct, FPA. Data shown for the FPA Queens Road Small Cap Value Fund – Investor Class (“Fund”). Inception of the Fund was June 13, 2002. The periods referenced above reflect Russell 2000 Value drawdowns 20% or greater and are calculated from that index’s peak and trough dates, (i.e., 6/28/2002-10/9/2002, 6/4/2007-3/9/2009, 6/23/2015-2/11/2016, 8/22/2018-3/23/2020, 11/8/2021-10/27/2023, 11/25/2024-4/8/2025). Please see page 1 for net performance of the Fund since inception. Please also see the end of this commentary for Important Disclosures and Definitions of Key Terms.
2 Source: What is Quality; https://papers.ssrn.com/sol3/papers.cfm?abstract_id=2971185
3 Source: A Five Factor Model ; https://www.sciencedirect.com/science/article/abs/pii/S0304405X14002323?via%3Dihub
4 Source: Morningstar; https://advisor.morningstar.com/enterprise/MorningstarFactorProfileUserGuide.pdf
5 Source: Factset QRSVX vs. Russell 2000 Value Index two factor attribution sorted by GICS sectors.
Queens Road Small Cap Value Fund 2025 Q1 Attribution
Queens Road Small Cap Value Fund 2025 Q3 Attribution
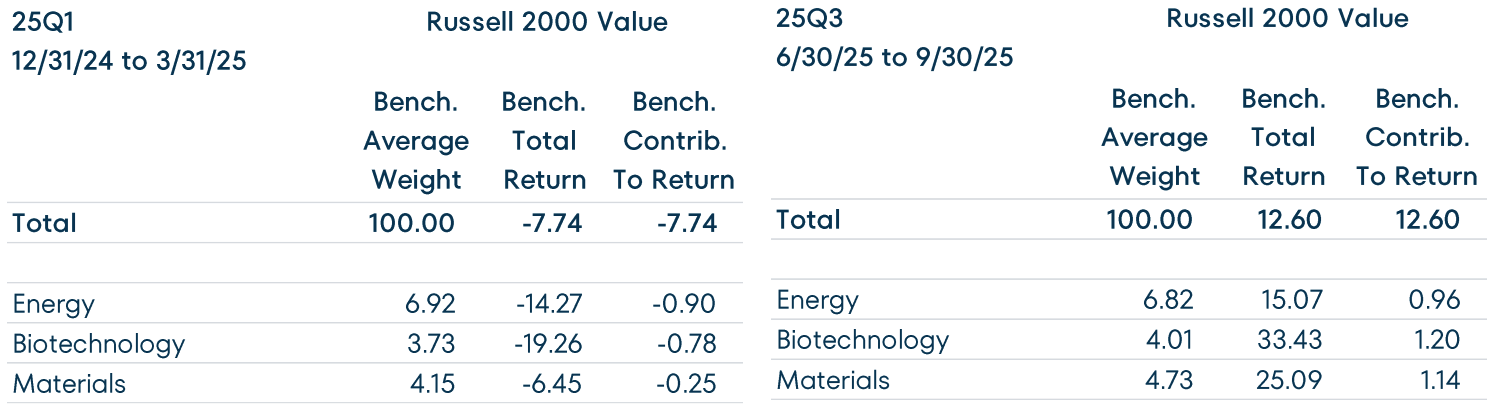
Three exceptions to our sector agnosticism are energy, materials, and pharma/biotech. From a bottom-up analysis, companies in these sectors tend to have inconsistent earnings and high capital intensity (and a tendency toward misallocation of capital) and don’t meet our definition of quality. These sectors underperformed in Q1 and outperformed in Q3 supporting our assertion that junk, as we tend to view it, led the market down in Q1 and up in Q3. (Materials outperformed slightly in Q1.)
Sector Attribution – Energy, Biotechnology and Materials
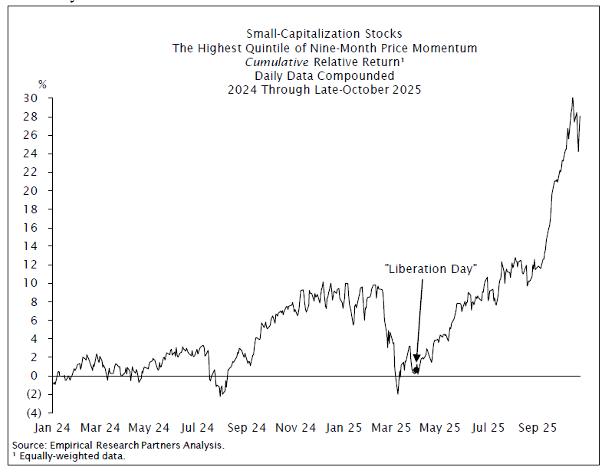
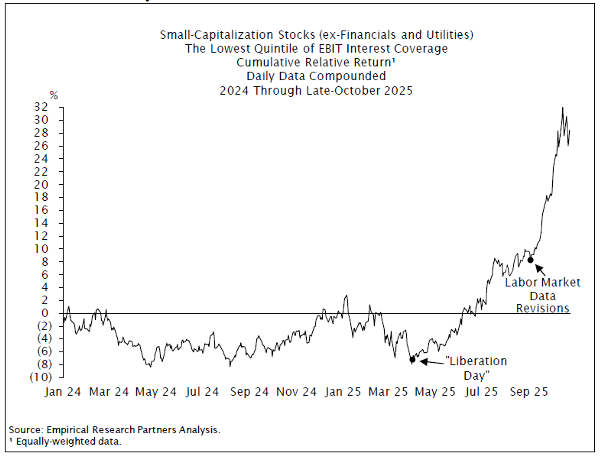
According to the strategists at Empirical Research Partners, small cap momentum stocks and small cap low-interest-coverage stocks have been exceptionally strong since “Liberation Day” in early April. In each case, relative performance really took off in Q3.6
The strategists at Goldman track a collection of investment themes. A collection of junkier themes has trounced “Quality Compounders” since Liberation Day in early April (borrowed from the Fiduciary Management Inc. Q3 letter).7 This corroborates what we are seeing from the bottom up where, Q3 in particular, felt like a junky rally.
6 Source: Empirical Research Partners Portfolio Strategy October 2025: Small-Caps: Big Mo in Small Cos.
7 From the Fiduciary Management Investment Council 25Q3 Investment Strategy Outlook Letter: https://www.fmimgt.com/fmi/corp/Letters/iso_20250930.pdf
Sector Attribution – Energy, Biotechnology and Materials
Goldman Sachs – Top Performing Themes
Top 10 Contributors in 2025 (Through 9/30)
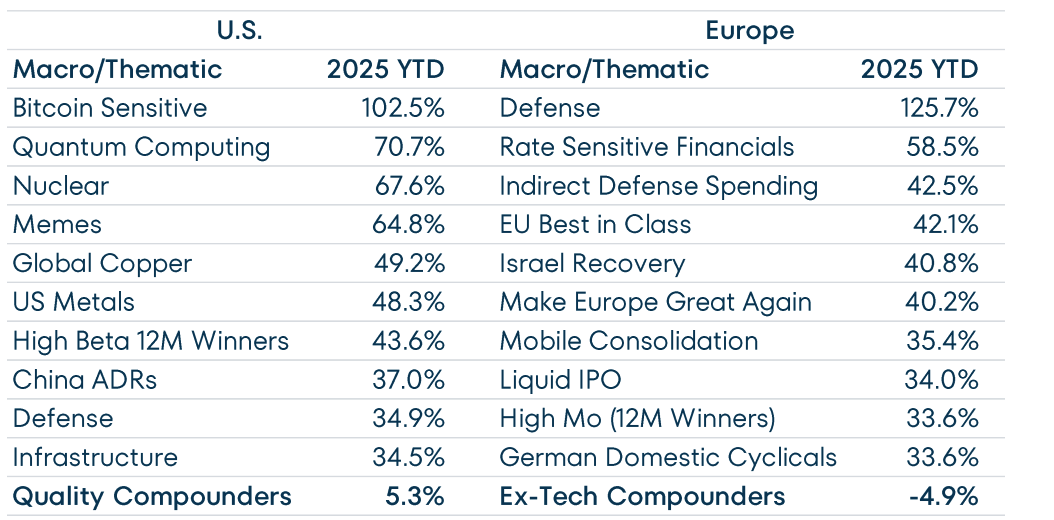
* Goldman Sach Macro/Thematic baskets. Stocks are selected by Goldman Sachs specialists. Baskets are rebalanced on a quarterly basis.
Finally, the Fund performance this year has been inversely correlated to Morningstar’s Global Quality Factor, which is based on 50% debt to capitalization and 50% return on equity as described above. In Q1, Quality was Morningstar’s worst performing factor and Morningstar noted that “historically, the Morningstar Quality Factor Indexes exhibited a similar level of risk to their parent benchmarks.”8 In Q3, Morningstar’s Global Quality Factor returned 7.51%, just behind the Morningstar Global Momentum Factor at 9.62% and Morningstar Global Value Factor at 9.55% but significantly above the Morningstar Global Low Volatility Factor at .90%.9
The data above are for Morningstar’s global quality factor – so it’s not an apples-to-apples comparison to our U.S. small cap Fund. The Morningstar quality factor is valuation agnostic and is meant to be a constituent in multi-factor portfolios. We don’t have access to quality factor returns by other investors. But the point is that it is reasonable that our holistic, bottom-up process and concentrated portfolio should look different from a quantitative process that is meant to categorize a broad universe of companies based on a narrow set of criteria.
We will continue to apply extreme discipline in researching individual companies that we believe will be both resilient in downturns and compound at attractive rates of return over the long term.
8 Source: Morningstar; https://indexes.morningstar.com/insights/markets-review/bltd9a242a7280e6745/morningstar-factor-monitor-q1-2025
9 Source: Morningstar; https://indexes.morningstar.com/insights/analysis/blt38fa44e53b25d808/morningstar-factor-monitor-q3-2025
Portfolio Commentary
We continue to re-balance the risk and reward in the portfolio. Both the Fund and the Russell 2000 Index performed well during the third quarter of 2025, which gave us the opportunity to rebalance the portfolio toward higher-quality holdings. For us, the three most important elements of quality are balance sheet strength, earnings consistency, and returns on capital. Balance sheet strength allows for resilience in the face of challenges. Earnings consistency indicates that the company is likely to continue being profitable going forward. And high returns on capital suggest the company uses its resources to produce economic value.
We did not add any new positions in the third quarter.
In Q3, we made significant additions to our holdings in Nelnet (NNI), RLI Corp (RLI), and Ingles Markets (IMKTA). Nelnet and Ingles were new additions to the portfolio in Q2, and we continued to build our positions. RLI is a high-quality insurer with strong Combined Ratios and Return on Equity (ROE) that has been owned by the Fund since 2011. We generally like investing in insurers because they take minimal credit risk and are able to pass through cost inflation (with a lag) and are pleased to add to RLI at an attractive price.
We did not have any significant reductions to our holdings in the quarter. The take private of Enstar Group (ESGR) was completed on July 2, 2025.10
At quarter end, our cash position was 10.1%, up from 8.3% at the end of Q2. The increase in cash was due to significant inflows and an approximately 3% position in Enstar that was bought out during the quarter.
10 Sixth Street completes acquisition of Enstar (https://investor.enstargroup.com/news-releases/news-release-details/sixth-street-completes-acquisition-enstar).
Trailing Twelve Month Top and Bottom Contributors11
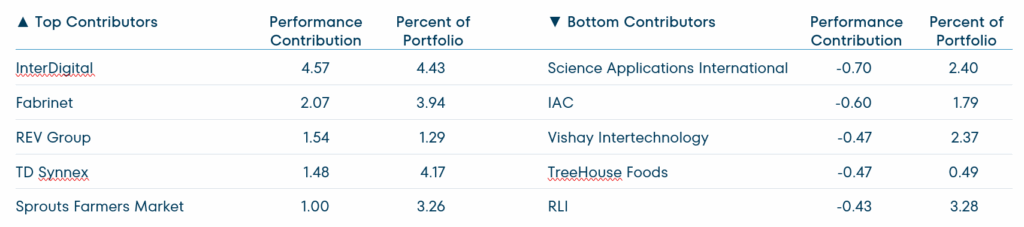
11 Reflects the top contributors and top detractors to the Fund’s performance based on preliminary contribution to return for the trailing twelve months (TTM) period ending September 30, 2025. Contribution is presented gross of investment management fees, transactions costs, and Fund operating expenses, which if included, would reduce the returns presented. Portfolio weights represent the average weights over the periods noted. A copy of the methodology used and a list of every holding’s contribution to the overall Fund’s performance during the quarter to date (QTD) and year to date (YTD) is available by contacting [email protected]. It should not be assumed that recommendations made in the future will be profitable or will equal the performance of the securities listed. Totals may not sum due to rounding. Note: September, 30, 2025 company descriptions were developed by the investment team and unless otherwise noted reflect the most recent data made available by the companies or third-party research firms the investment team believe to be reliable.
Top Contributors
- InterDigital (IDCC) is a R&D organization that develops and acquires wireless communication and video patents. The company has a history of strong financial performance, opportunistically buys back shares, and pays a modest dividend. IDCC has been successfully renewing its wireless licensing agreements (Apple in 2022, Samsung in 2023) and has a growing stream of recurring licensing revenues across consumer electronics, internet of things (IoT), and automotive customers.12 CEO Liren Chen joined in 2021 from Qualcom and has been hiring other former Qualcom managers. The company’s share price has increased over the past year on growing revenue, profitability, and buybacks. We began trimming the Fund’s position this year.
- Fabrinet (FN) is a contract manufacturer specializing in optical networking equipment and modules. This is complex work at small scales, and Fabrinet dominates its niche. Fabrinet has experienced impressive historical revenue growth and growing operating margins. The company’s highest bandwidth products are finding increasing demand in data centers, especially those data centers used to train artificial intelligence models. In 2023, Fabrinet disclosed that Nvidia is a 10% customer. The stock price has roughly doubled since April on rising expectations for data center spending. -We believe such spending may have gotten ahead of itself and have been trimming. But the need for high bandwidth networking will continue, Fabrinet dominates its core telecom and data center markets and has prudently diversified into auto components and laser assembly. We believe Fabrinet will be a “compounder” for many years, and we continue to hold a position.
- REV Group (REVG) is a specialty vehicle manufacturer. Most of the company’s value is in its municipal business where REV Group makes fire trucks and ambulances. The company has been reporting significant backlog and pricing growth in concert with Pierce Manufacturing (owned by Osh Kosh (OSK), another Fund holding), their primary competitor in the fire truck business. CEO Mark Skonieczny has led a significant operational restructuring, sold off the less profitable bus business, and used the proceeds to buy back stock at attractive prices. The stock price has followed improving results and performed well.
- TD Synnex (SNX) is the largest information technology (IT) distributor globally. 20 years ago, IT distribution involved getting personal computers (PCs), servers, and routers from the manufacturer to the customer. But TD Synnex adds value by acting as an outsourced sales force for its suppliers and providing IT consulting to its customers. The business has evolved, and the company sells increasing amounts of software, security solutions, cloud licenses, and other growth-y IT at attractive margins. Shares have performed well this year as billings growth has rebounded to a double digit rate, led by TD Synnex’s more complex and higher margin Advanced Solutions portfolio. We believe that SNX shares are still attractive at the current valuation of roughly 12x this year’s earnings.
- Sprouts Farmers Market (SFM) is a supermarket chain focusing on fresh, natural, and organic products. The company has strong operating margins, attractive returns on capital, and excellent new store economics.13 Sprouts accelerated its unit growth from 12 stores a year to 33 stores in 2024 on a base of roughly 400 stores – very attractive unit economic growth. Through April of this year, SFM’s stock performed extremely well in concert with strong operating results and rising earnings estimates. But sales growth, and the SFM share price, have lagged since. We began trimming our position and taking gains in the third quarter of 2024 as the company’s valuation entered the upper end of our “range of reasonableness.”
12 Interdigital News and Events (https://ir.interdigital.com/news-events/press-releases/default.aspx)
13 For the year ending Dec-24, Sprout’s operating margin was 6.7%. (Source: Form 10-K for the year ended December 31, 2025).
Bottom Contributors
- Science Applications International Corp (SAIC) is a government contractor that provides engineering and IT services, roughly split 50/50 between defense and civilian agencies. Government contractor stocks have performed badly as the Trump administration has promised to cut government spending and waste – first through the Department of Government Efficiency (DOGE) and now through a more ad hoc series of Executive announcements and mandates. Investors are struggling to figure out the magnitude of the cuts and which companies are exposed. SAIC shares sold off aggressively when they reported a 3% decline in revenue and reduced Jan-26 fiscal year estimates during their September 4th earnings release.14 We believe SAIC’s services generally make the government more efficient and that the current valuation, at roughly 10x earnings, discounts a punitive velocity of cuts to SAIC’s programs.
- IAC Inc (IAC) is a consumer technology conglomerate founded and helmed by Barry Diller. The company has a history of incubating consumer technology brands and then spinning them off to realize value – past spinoffs include Expedia, Live Nation, TripAdvisor, Match Group and Angi (which was spun off earlier this year). Today’s IAC is following the same playbook and owns DotDash Meredith, a collection of media websites including People, Allrecipes, and Better Homes & Gardens; 24% of publicly traded MGM Resorts International, a casino operator; 32% of Turo, an auto sharing network; Care.com; and Vivian, a job website for healthcare workers. The market is reluctant to ascribe a full valuation to IAC on a “sum of the parts” basis while the company is suppressing cash flow to make investments, and there is no current stated plan to realize value by spinning or selling assets. We believe that the asset value at IAC exceeds the share price and that the company has a history of value realization over the long term. We continue to hold IAC as a midsized position in the portfolio.
- Vishay Intertechnology (VSH) makes passive electronic components and discrete semiconductors (resistors, inductors, capacitors, MOSFETs, diodes, etc.). Although its industry is cyclical, competitive dynamics are stable and VSH benefits from incremental growth in electric vehicles and industrial electrification. The industry is currently emerging from a cyclical downturn following the excesses and component hoarding of the Covid era. Additionally, following its April 2024 Investor Day, Vishay has been aggressively investing in sales, corporate, and manufacturing capacity. Vishay is also strategically changing a company culture that was notably staid and overly-conservative.15 We are cautiously optimistic about Vishay’s growth plans and have been adding to the position during this cyclical weakness.
- Treehouse Foods (THS) manufactures private label packaged foods, mostly for grocery chains. The company makes everything from crackers to broths to pickles to cheese. Treehouse never found its footing after levering up for the acquisition of ConAgra’s private label business in 2016, and growth and margins have been inconsistent ever since. Over the last year, continued supply chain and operational issues have weighed on the company’s profitability and stock price. THS was a relatively small position in the Fund and we have fully exited as of the end of third quarter.
- RLI Corp (RLI) is a specialty property and casualty insurer. The company is extremely selective in writing business. Its diversified lines include niche-y areas such as public and school busses, Hawaii homeowners, and surety. RLI’s unique culture, incentive structures and willingness to walk away from unprofitable business have historically led to exceptional financial performance. From 2015 through 2024, the company’s combined ratio has averaged 89.3% and its ROE has averaged 16.6% despite being weighed down by excess capital. We have owned RLI since 2011 and the stock usually commands a premium valuation – we are pleased to be able to add to our position at roughly 20x this year’s earnings.
14 Source: SAIC Fiscal 2026 Q2 earnings release; https://investors.saic.com/financial-information/quarterly-results
15 Source: Vishay Intertechnology April 2, 2024 Investor Day; https://ir.vishay.com/events/event-details/investor-day
Conclusion
While we can’t control short-term performance, we will continue to manage our portfolio with diligence, discipline, and patience. We never make predictions about market direction, but we feel good about the Fund’s long-term prospects. And we are particularly pleased when we perform as expected, with limited downside capture.
As always, and as significant co-investors in the Fund, we appreciate your trust in us to be good stewards of your capital. If you would like to discuss performance or the Fund’s portfolio holdings in greater detail, please let us know.
Respectfully,
Steve Scruggs, CFA, Portfolio Manager
Ben Mellman, Senior Analyst
September 30, 2025
Important Information
This Commentary is for informational and discussion purposes only and does not constitute, and should not be construed as, an offer or solicitation for the purchase or sale of any securities, products or services discussed, and neither does it provide investment advice. Any such offer or solicitation shall only be made pursuant to the Fund’s Prospectus, which supersedes the information contained herein in its entirety. This Commentary does not constitute an investment management agreement or offering circular.
The statements contained herein reflect the opinions and views of the portfolio managers as of the date written, is subject to change without notice, and may be forward-looking and/or based on current expectations, projections, and/or information currently available. Such information may not be accurate over the long-term. These views may differ from other portfolio managers and analysts of the firm as a whole and are not intended to be a forecast of future events, a guarantee of future results or investment advice.
Portfolio composition will change due to ongoing management of the Fund. References to individual securities or sectors are for informational purposes only and should not be construed as recommendations by the Fund, the portfolio manager, the Adviser, the Sub-Adviser or the distributor. It should not be assumed that future investments will be profitable or will equal the performance of the security or sector examples discussed. The portfolio holdings as of the most recent quarter-end may be obtained at fpa.com.
Future events or results may vary significantly from those expressed and are subject to change at any time in response to changing circumstances and industry developments. The information and data contained herein has been prepared from sources believed reliable, but the accuracy and completeness of the information cannot be guaranteed and is not a complete summary or statement of all available data.
The information contained herein is not complete, may change, and is subject to, and is qualified in its entirety by, the more complete disclosures, risk factors, and other information contained in the Fund’s Prospectus and Statement of Additional Information. The information is furnished as of the date shown. No representation is made with respect to its completeness or timeliness. The information is not intended to be, nor shall it be construed as, investment advice or a recommendation of any kind.
Certain statements contained in this presentation may be forward-looking and/or based on current expectations, projections, and information currently available. Actual events or results may differ from materially those we anticipate, or the actual performance of any investments described herein may differ from those reflected or contemplated in such forward-looking statements, due to various risks and uncertainties. We cannot assure future results and disclaim any obligation to update or alter any forward-looking statements, whether as a result of new information, future events, or otherwise. Such statements may or may not be accurate over the long-term. Statistical data or references thereto were taken from sources which we deem to be reliable, but their accuracy cannot be guaranteed.
The reader is advised that the Fund’s investment strategy includes active management with corresponding changes in allocations from one period of time to the next. Therefore, any data with respect to investment allocations as of a given date is of limited use and may not be reflective of the portfolio manager’s more general views with respect to proper geographic, instrument and /or sector allocations. The data is presented for indicative purposes only and, as a result, may not be relied upon for any purposes whatsoever.
In making any investment decision, you must rely on your own examination of the Fund, including the risks involved in an investment. Investments mentioned herein may not be suitable for all recipients and in each case, potential investors are advised not to make any investment decision unless they have taken independent advice from an appropriately authorized advisor. An investment in any security mentioned herein does not guarantee a positive return as securities are subject to market risks, including the potential loss of principal. You should not construe the contents of this document as legal, tax, investment or other advice or recommendations.
Fund performance presented is calculated on a total return basis, which includes the reinvestment of all income, plus realized and unrealized gains/losses, if applicable. Unless otherwise indicated, performance results are presented on a net of fees basis and reflect the deduction of, among other things: management fees, brokerage commissions, operating and administrative expenses, and accrued performance fee/allocation, if applicable.
The information provided in this presentation is based upon data existing as of the date(s) of the report and has not been audited or reviewed. While we believe the information to be accurate, it is subject in all respects to adjustments that may be made after proper review and reconciliation.
Investments carry risks and investors may lose principal value. Capital markets are volatile and can decline significantly in response to adverse issuer, political, regulatory, market, or economic developments. Securities of smaller, less well-known companies involve greater risks and they can fluctuate in price more than larger company securities. You risk paying more for a security than you received from its sale.
The Fund primarily invests in equity securities (common stocks, preferred stocks and convertible securities) of small-capitalization U.S. companies, defined as those with market-capitalization, at the time of purchase, that is no greater than the largest market-capitalization of any company included in the Russell 2000 Index. Investing in small companies involves special risks including, but not limited to, the following: smaller companies typically have more risk and their company stock prices are more volatile than that of large companies; their securities may be less liquid and may be thinly traded which makes it more difficult to dispose of them at prevailing market prices; these companies may be more adversely affected by poor economic or market conditions; they may have limited product lines, limited access to financial resources, and may be dependent on a limited management group; and small-cap stocks may fluctuate independently of large-cap stocks. All investment decisions are made at the discretion of the Portfolio Manager, in accordance with the then current Prospectus. Comparison to any index is for illustrative purposes only.
The prices of securities held by the Fund may decline in response to certain events taking place around the world, including those directly involving the companies whose securities are owned by the Fund. Securities in the Fund’s portfolio may underperform due to inflation (or expectations for inflation), interest rates, global demand for particular products or resources, natural disasters, pandemics, epidemics, terrorism, regulatory events and governmental or quasi-governmental actions. There is a risk that you may lose money by investing in the Fund.
Value style investing presents the risk that the holdings or securities may never reach their full market value because the market fails to recognize what the portfolio management team considers the true business value or because the portfolio management team has misjudged those values. In addition, value style investing may fall out of favor and underperform growth or other styles of investing during given periods.
Please refer to the Fund’s Prospectus for a complete overview of the primary risks associated with the Fund.
©2025 Morningstar, Inc. All Rights Reserved. The Morningstar information contained herein: (1) is proprietary to Morningstar and/or its content providers; (2) may not be copied or distributed; and (3) is not warranted by Morningstar to be accurate, complete, or timely. Neither Morningstar nor its content providers are responsible for any damages or losses arising from any use of this information. Past performance is no guarantee of future results.
The FPA Funds are distributed by Distribution Services, LLC. 190 Middle Street, Suite 301, Portland, ME 04101. Distribution Services, LLC and FPA are not affiliated.
Index Definitions
Comparison to any index or benchmark is for illustrative purposes only and should not be relied upon as a fully accurate measure of comparison. The Fund may be less diversified than the indices noted herein and may hold non-index securities or securities that are not comparable to those contained in an index. Indices will hold positions that are not within the Fund’s investment strategy. Indices are unmanaged and do not reflect any commissions, transaction costs, or fees and expenses which would be incurred by an investor purchasing the underlying securities and which would reduce the performance in an actual account. You cannot invest directly in an index.
The Russell 2000 Index measures the performance of the small-cap segment of the U.S. equity universe. It is a market cap weighted index that includes the smallest 2,000 companies covered in the Russell 3000 universe of United States-based listed equities.
The Russell 2000 Value Index measures the performance of the small-cap value segment of the U.S. equity universe. It includes those Russell 2000 companies that are considered more value oriented relative to the overall market as defined by Russell’s leading style methodology.
Standard & Poor’s 500 Stock Index (S&P 500) is a-capitalization-weighted index which covers industrial, utility, transportation and financial service companies, and represents approximately 75% of the New York Stock Exchange (NYSE) capitalization and 30% of NYSE issues. The S&P 500 is considered a measure of large-capitalization stock performance.
Standard & Poor’s 600 Stock Index (S&P 600) is an index of small-cap stocks managed by Standard & Poor’s. It tracks a broad range of small-sized companies that meet specific liquidity and stability requirements. This is determined by specific metrics such as public float, market capitalization, and financial viability, among other factors.
Small-cap Value Companies: The term small-cap describes companies with a relatively small market-capitalization. A company’s market-capitalization is the market value of its outstanding shares. The definition for small-cap varies, but generally means a company with $300 million to $2 billion in market-capitalization.
Glossary of Terms
Downside-capture ratio is used to evaluate how well an investment manager performed relative to an index during periods when that index has fallen. The ratio is calculated by dividing the manager’s returns by the returns of the index during the down market,and multiplying that factor by 100. BPS or basis points; 1 bps is equal to 0.01%.
Earnings per share (EPS) is calculated as a company’s profit divided by the outstanding shares of its common stock.
Expected earnings are an estimate for a company’s future quarterly or annual earnings per share (EPS).
Forward earnings are an estimate of the next period’s earnings of a company, usually through the completion of the current fiscal year and sometimes to the following fiscal year.
Free Cash Flow represents the cash a company can generate after required investment to maintain or expand its asset base.
Margin of Safety – Buying with a “margin of safety” is when a security is purchased at a discount to the portfolio manager’s estimate of its intrinsic value. Buying a security with a margin of safety is designed to protect against permanent capital loss in the case of an unexpected event or analytical mistake. A purchase made with a margin of safety does not guarantee the security will not decline in price.
Market Cycle Performance is defined as a period that contains a decline of at least 20% from the previous market peak over at least a two-month period and a rebound to establish a new peak above the prior market peak.
Price/Earnings Ratio (P/E) is the price of a stock divided by its earnings per share. Percentages are based on the absolute number of shares. P/E ex-Neg EPS is Price/Earnings ex negative earnings per share. P/E, average P/E, or P/E (trailing) is based on the last 12 months of actual earnings. P/E, next 12 months or P/E (forward) utilizes forward earnings expectations over the next 12 months to calculate the ratio.
Return on Equity (ROE) measures a corporation’s profitability by revealing how much profit a company generates with the money shareholders have invested.