
You should consider the Fund’s investment objectives, risks, and charges and expenses carefully before you invest. The Prospectus details the Fund’s objective and policies, charges, and other matters of interest to a prospective investor. Please read the Prospectus carefully before investing. The Prospectus may be obtained by visiting the website at fpa.com, by email at [email protected], toll-free by calling 1-800-982-4372 or by contacting the Fund in writing.
Average Annual Total Returns (%)

Index data source: Morningstar.
Past performance is no guarantee, nor is it indicative, of future results. Current performance may be higher or lower than the performance shown. This data represents past performance and investors should understand that investment returns and principal values fluctuate, so that when you redeem your investment it may be worth more or less than its original cost. Current month-end performance data, which may be lower or higher than the performance data quoted, may be obtained at fpa.com or by calling toll-free, 1-800-982-4372. The Fund’s Total Annual Operating Expenses are 0.94% (Investor Class), 0.88% (Advisor Class), and 0.80% (Institutional Class).
The FPA Queens Road Small Cap Value Fund (“Fund”) commenced operations on June 13, 2002 (Inception date). Fund performance shown is for the Investor Class shares (QRSVX). Periods greater than one year are annualized. Fund performance is shown net of all fees and expenses and includes reinvestment of all distributions. Fund performance does not reflect the deduction of taxes that a shareholder would pay on Fund distributions or the redemption of Fund shares, which would lower these figures. An investor cannot invest directly in an index.
Prior to November 1, 2020, the performance shown reflects the historical performance of the Fund when Bragg Financial Advisors, Inc. (“BFA”) served as investment adviser of the Fund.
From inception of the Fund to December 31, 2004, BFA and its affiliates voluntarily absorbed certain expenses of the Fund and voluntarily waived its management fee. Had BFA not done this, returns would have been lower during that period. Effective January 1, 2005 through October 31, 2020, BFA charged a single unitary management fee and contractually agreed to pay all operating expenses of the Fund except for brokerage, taxes, interest, litigation expenses, and other extraordinary expenses. Prior to November 1, 2020, the Fund had a unitized fee structure that limited annual operating expenses to 1.18%.
Please see additional important disclosures at the end of this Commentary.
Dear Fellow Shareholder:
The FPA Queens Road Small Cap Value Fund (“Fund”) returned 19.76% in the second quarter of 2026 vs. 17.19% for the Russell 2000 Value Index (“R2KV”). Year to date, the Fund returned 27.02% vs. 22.99% for the R2KV. We are pleased with this performance – we outperformed in a strong market as a result of exceptionally strong returns across some of our technology holdings and good returns across the remainder of our portfolio. More detail can be found in the “Market Commentary” section of this letter.
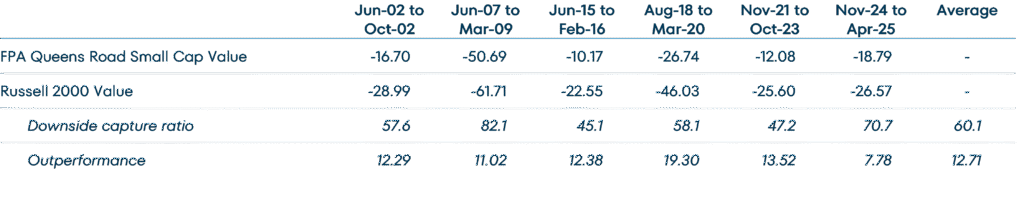
Our four-pillar investment process focuses on identifying high-quality companies at attractive valuations. We tend to look down before we look up and are willing to sacrifice some upside capture in speculative markets. While we are pleased with our results given current market conditions, we want to remind our investors that we expect to hold up better than our benchmark in down markets and trail in speculative markets as a result of our diligent, disciplined, and patient process.
20% or Larger Russell 2000 Value Drawdowns Since Fund Inception (%)1
Operational Updates
Before we discuss our YTD performance we want to provide an update on several operational changes that have recently taken place. The investment in these initiatives is part of the natural evolution of the Fund. While our core investment philosophies haven’t changed since the Fund’s founding in 2002, we are always looking to make improvements that will lead to a better investment process and a better experience for our investors. The changes below are significant in their scope and the effort required from the entire FPA team.
In Q2 and post quarter end, we participated in several additional liquidity trades. In these transactions, we use a portfolio rebalancing tool to dispose of securities through a redemption in kind mechanism, similar to that used by ETFs. These trades allow us to exit a collection of stocks with minimal market impact. They have the secondary effect of enhancing tax efficiency. We think our current set of tools, coupled with our generally low-turnover approach, should support our goal of minimizing capital gain distributions.
Our portfolio turnover, typically 10% – 15%, has been somewhat elevated this year as we sold down some big winners and rebalanced the risk and reward in our portfolio. In Q2, we eliminated $62m of capital gains, while year to date (including July), we disposed of assets with approximately $140m of imbedded capital gains as a byproduct of the portfolio rebalancing tool and the ongoing use of Reflow, an additional liquidity service.2 If you would like to discuss these liquidity trades in more detail, please reach out.
Secondly, we implemented our new order and execution management system (OEMS), Enfusion. Enfusion will enhance our trading, allocation, and compliance and adds additional portfolio management and analytical tools. The implementation process has been a heavy lift but we expect our upgraded OEMS to add significant value.
Finally, at the beginning of June, we hired Joseph Wang as an analyst. Joseph most recently worked at a Charlotte based long biased hedge fund as a generalist, and before that, at a value focused advisor in Texas. Joseph started working with us at the end of last year on a prospective basis – we spent significant time getting to know him to make sure he is a good fit with our investment philosophy and process. We are particularly attracted to Joseph’s conservative temperament and his pro-active ability to get things done, a rare combination. We believe that Joseph will make significant contributions to the Fund sooner rather than later and are delighted to add him to the team. Welcome Joseph!
Market Commentary
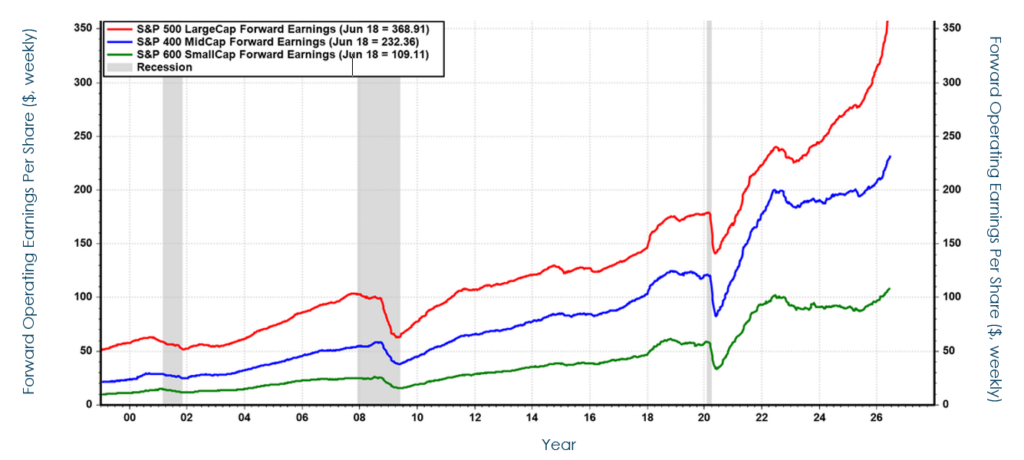
Small caps had strong performance during the first half of 2026. Our benchmark, the Russell 2000 Value Index (R2KV), gained 22.99% and the higher quality S&P600 was up roughly equivalently at 23.90%.3 Value and growth both performed well. The Russell 2000 Value Index slightly outperformed the Russell 2000 while the S&P600 Value Index slightly trailed the S&P600. Notably, the small cap indices outperformed the S&P500 for the first half of 2026 as small company earnings growth, which had been non existent since 2022, finally kicked in and outpaced larger cap earnings growth. Of course small-caps had the benefit of starting the year from much lower absolute valuations.
S&P 500/400/600 Forward operating Earnings Per Share (dollars, weekly)4
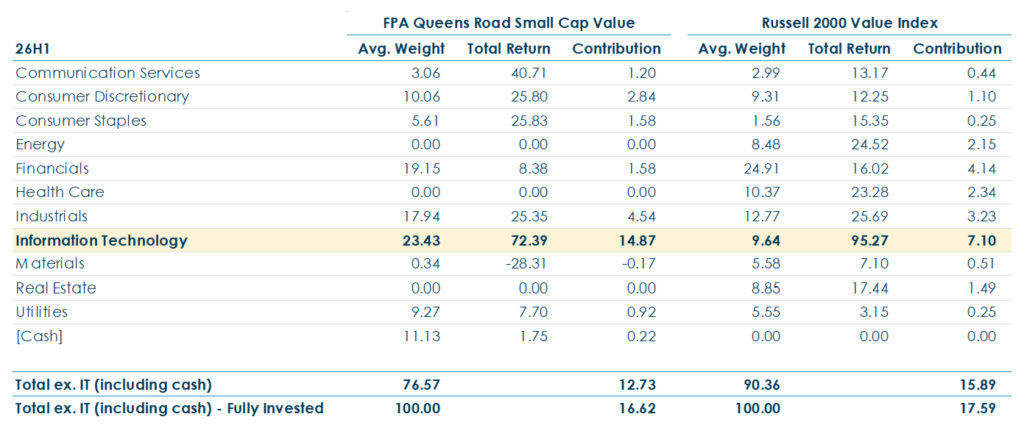
For the market as a whole, semiconductors and momentum outperformed.5 Anecdotally, the AI trade ran rampant as investors extrapolated “vertical” demand for compute. Excepting information technology which was up nearly 100% in 26H1, small-cap performance was relatively consistent across sectors. All sectors had double digit gains with the exception of Utilities and Materials, which gained 3% and 7% respectively.6
For 26H1, the Fund outperformed its benchmark returning 27.02% vs. 22.99% for the Russell 2000 Value Index. Similar to the index, the Fund benefitted from outsized performance in a handful of technology stocks. But the remainder of the portfolio also performed well with appropriate dispersion and no significant detractors. We like to say that we are benchmark agnostic when we invest – we approach investing from the bottom up resulting in significant deviations from our benchmark. But we strive to be well diversified at the portfolio, sector, and industry level. Our diversification just might not look like the index’s diversification. Putting aside our technology exposure, this worked well in 26H1.7
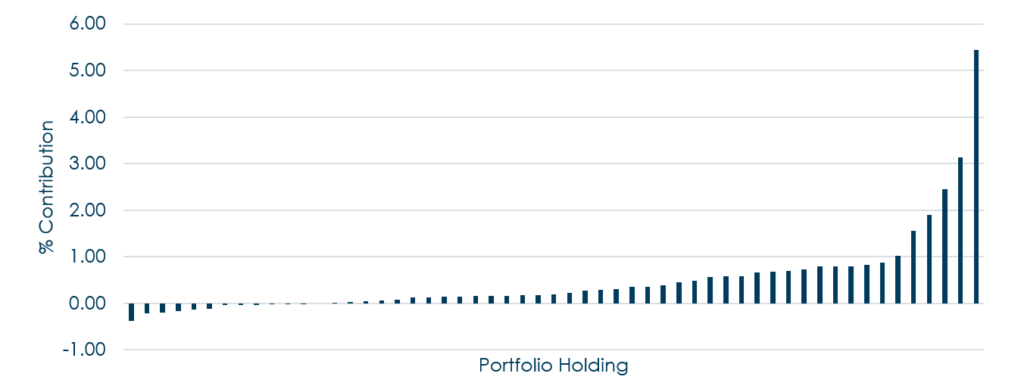
The chart below shows the 26H1 contribution from each of the Fund’s portfolio holdings, ordered from smallest (detractors) to largest. This distribution looks smooth and well behaved – except for the right tail where we benefitted from five information technology holdings (Vishay, TD Synnex, Arrow, Littelfuse, and Synaptics) each of which contributed significantly more than 1%. For what it’s worth, the next five top contributors, with contributions ranging from 1.01% to .79%, were not technology holdings (Scholastic, Ducommun, MSC, Advance Auto and Ingles).
26H1 Contribution by Portfolio Holding (%)
Our technology holdings drove our returns during the period. We would like to provide some detail and explain how our fundamental, bottom-up process drove the Fund to own a significant allocation in technology. There are three important points:
- The technology stocks that were big winners for us in 26H1 were (very) long term holdings. We initially invested in them based on our four pillar process. We believed that these companies would benefit from broad economic growth and increased electrification and technology spending, including, it turns out, AI and data centers. But we did not anticipate or chase the AI trade.
- Most of our technology holdings are component manufacturers, distributors or service companies. These are not the high flying tech stocks in the headlines or valued based on total addressable market (i.e. ’hope’). Our holdings have lower growth (with some cyclicality), consistent profitability and relatively stable competitive dynamics with less risk from product cycles and obsolescence.
- The large and rapid appreciation in the share prices of our technology holdings means that the risk/reward changed. We have significantly trimmed these positions and reallocated the proceeds into what we believe are more attractively valued, high quality companies.
Before we discuss individual companies, the tables below classify our technology holdings into four categories: component manufacturers and distributors that sell into diverse end markets including data centers (our biggest winners); a distributor and value added retailer that are tied to corporate IT spending; companies with explicit AI exposure; and other idiosyncratic business models.
We purchased ePlus in 2025 and Vontier in 2026 – neither has any data center exposure. We bought Qorvo in 2022 and exited earlier this year after it was announced that Qorvo is being acquired by competitor Skyworks (SWKS). The remainder of our technology purchases significantly precede the AI trade.
Technology Holdings – Portfolio Weight by Date
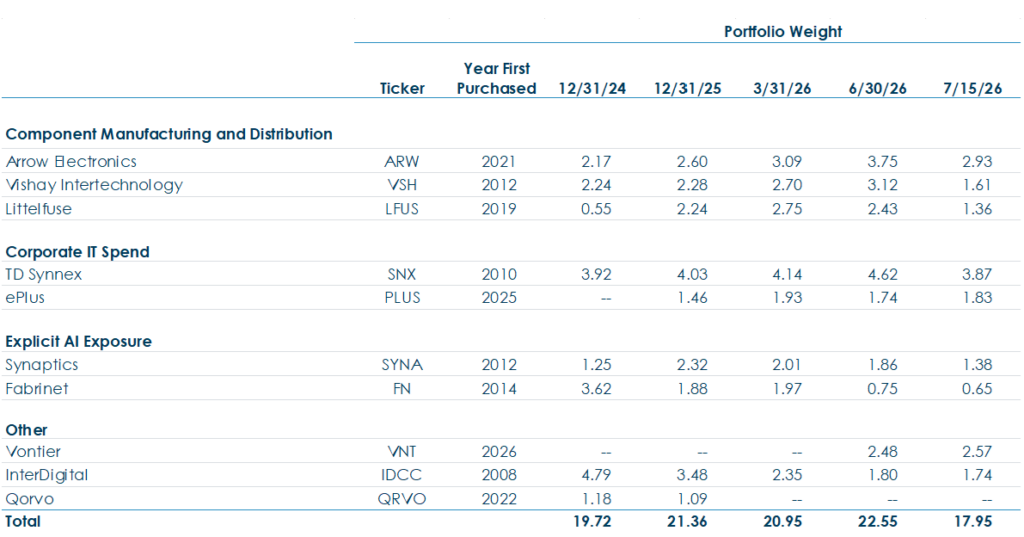
Although we have trimmed our holdings based on rising valuations, we haven’t fully exited these positions. We don’t model an exact intrinsic value for our holdings. Instead, we believe that valuations can exhibit a “range of reasonableness” and are willing to hold on to smaller positions at fuller valuations in companies we like (to a limit). In this case, we believe that technology spending, not just data centers, will continue to grow at GDP+ rates for the foreseeable future. And we have confidence in our management teams to foster innovation and take advantage of the opportunities in front of them.
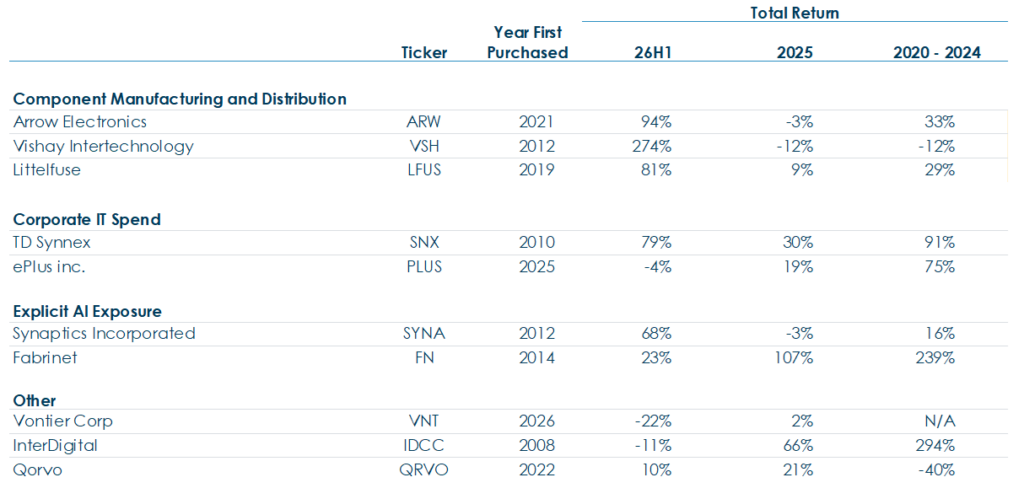
A handful of these companies have had exceptional YTD returns. Fabrinet, TD Synnex and InterDigital have been very strong performers over multiple years.
Technology Holdings – Total Return
Component Manufacturing and Distribution
Component Manufacturing and Distribution has been our largest and best performing subcategory this year. Arrow (ARW) is the largest semiconductor distributor globally while Vishay (VSH) and Littelfuse (LFUS) are manufacturers of passive components and discrete semiconductors. These companies sell a broad range of niche products with economies of scale and scope. Although there is consistent technological improvement, Arrow, Vishay and Littelfuse sell established technologies and so product cycle and obsolescence risk is minimal. Competitive dynamics are stable and these companies earn strong margins and returns on capital.
We liken these companies to ball bearing manufacturers but for the digital rather than the mechanical age. Their products go into absolutely everything across a diversity of end markets and these companies have grown at a GDP+ rate as electrification content multiplies across different industries. The products are low cost but high value and incremental technological improvements and quality matter a lot as the cost of failure is high.
But Arrow, Vishay and Littelfuse are cyclical and Covid introduced the mother of all cycles. These companies benefitted greatly from component shortages and hoarding as demand boomed and supply chains faltered in 2021 and 2022. In 2024 and 2025, as their end markets slowed, supply chains normalized and excess inventory in channel was worked off, overearning turned to underearning. Mid 2025 was the cyclical low and the share prices got hit again when President Trump announced global tariffs. We added significantly to our positions in these companies during the cyclical downturn.
This year, Arrow, Vishay and Littelfuse have benefitted from a strong cyclical rebound from a deep trough. But they have also benefitted from incremental sales into data centers – only Littelfuse gives us the exact figure and puts this at 8% – 10% of sales. The stock charts look like these companies have gotten caught up in the AI trade. All three holdings were up ~100% or more at some point this year. We think these companies will continue to compound value for shareholders, but the risk/reward has changed and we have been trimming aggressively.
Arrow and Littelfuse are very well run and we expect them to be compounders for many years. But Vishay is a messier and more volatile situation. Vishay is controlled by the Zandman / Shoshani family through super voting B shares. After struggling through the financial crisis, the family ran the company extremely conservatively and for cash flow. But starting in 2023, Vishay elevated its lead salesman, Joel Smejkal, to CEO and announced plans to change its notably staid culture and start investing in growth. These investments took down margins and cash flow in 2024 and 2025 as the industry was troughing out. Vishay’s share price fell from the mid $20s in 2024 to as low as $10/sh in 2025. We added to our position in a measured way knowing that Vishay was making significant changes with uncertain payoffs.
This year, revenue and bookings have surged upward and Vishay’s share price has followed. From a low of ~$10/sh last year, the stock traded above $60/sh in June (it has since given back some of those gains). Margins are still depressed, but in valuation terms, the EV/sales increased from a little over .5x to roughly 3x. Although we trimmed our position several times, Vishay was our largest winner for the first half of this year. The jury is still out on Vishay’s cultural reset and investment program, but the price has come back down and we are comfortable continuing to hold a less than 2% position.
Corporate IT Spending
TD Synnex (SNX) is the largest IT distributor globally.8 Twenty years ago, this meant getting PCs, peripherals, servers and networking equipment from the OEM manufacturer to the corporate customers’ offices. But the business has evolved and Synnex has used its position as a middleman to add additional products such as software, security, cloud licenses and services. Its predecessor companies (Tech Data and Synnex merged in 2021) were long time holdings of the Fund since 2010 and have consistently been among our largest holdings. ePlus (PLUS) is a value added reseller (VAR) with a similar business model, but lighter on holding inventory and heavier on the customer consultation, and was a 2025 addition to the portfolio. We like that these companies are broadly exposed to corporate IT spending and tend to grow faster and with less volatility than the industrial distributors.
Synnex has always had an entrepreneurial culture and has incubated several adjacent businesses over the years. One of these businesses, Hyve, helps build data centers by combining custom engineering, assembly and integration with TD Synnex’s core sourcing and distribution functions. This is obviously a very in demand service – Hyve growth has exploded from a single digit percentage of SNX’s sales in 2024 to almost 30% of expected operating income in 2026 (SNX could be included in the following section – Explicit AI Exposure). The share price has followed earnings growth higher and SNX’s market cap broached ~$20B in June.9 On the one hand TD Synnex is in the right place at the right time. But SNX has been an exceptional compounder for the Fund for over a decade – management always found smart ways to grow and improve the business. We have been trimming but think that the valuation remains reasonable at ~13x forward earnings
Explicit AI Exposure
We originally bought Synaptics (SYNA) in 2012 for exposure to its legacy business of designing chips that power touch controls and haptics for consumer electronics. But starting in 2020, the company began developing Astra – an integrated sensing, processing and communication solution to enable the industrial internet or internet of things (IoT). It turns out that Astra has an additional application in running AI processing on the edge – a function that was validated when Synaptics signed an extensive collaboration and co-development deal with Google Labs in 2025.10 On June 25, Synaptics agreed to be acquired by On Semi (ON) in an all stocks deal worth $7B.11
Fabrinet (FN) is the leading manufacturer of optical networking modules for telecom equipment and data centers. We have written about Fabrinet at length in previous letters – FN has been a top contributor to our performance since 2023 when the company announced Nvidia as a 10% customer and datacenter sales started skyrocketing. Similar to TD Synnex, when we first bought Fabrinet in 2014, we didn’t anticipate AI and massive data center spending. But we did think that the world was going to need a lot more high bandwidth communication and that Fabrinet seemed to be the best at manufacturing it. The stock performance has been exceptional and we have trimmed all the way up – Fabrinet now sits in the portfolio at a less than 1% position due to valuation.
Other
Vontier (VNT) is a Q2 purchase we will discuss in the next section. Its core business is manufacturing tanks, pumps and payment systems for gas stations. VNT is categorized by GICS as a technology company, but we think that it is an industrial.
Interdigital (IDCC) owns an expansive collection of wireless patents. Most of their revenue comes from licensing agreements with smart phone manufacturers, but the company has also started licensing to consumer electronics, auto, industrial and media companies. CEO Liren Chen joined in 2021 from Qualcom and has done an exceptional job ramping up the pace of licensing deals. The stock price has followed earnings growth higher and IDCC was a top performer for the Fund in 2023, 2024 and 2025. We have trimmed all the way up but still hold a less than 2% position in IDCC.
Qorvo (QRVO) makes semiconductors used in wireless communications. Its business always traded cheaply due to customer concentration but Qorvo seems to be protected by its specialized knowledge and know-how. When QRVO agreed to be acquired by competitor Skyworks (SWKS) in late 2025 in a cash and stock deal, we sold our position.
_________________________
Our information technology holdings performed very well (+72.39%) in the first half of the year. But they actually trailed the performance of Russell 2000 Value Index’s technology sector which returned 95.27%. When looking at traditional two factor attribution, our outperformance comes from an overweight sector allocation while security selection was actually a detractor. We don’t think of it that way and believe this shows the limitations of attribution analysis when applied to the Fund.
Everything we do is from the bottom up. Our technology holdings were added to the portfolio one by one because they fit our stringent four pillar process. We made the case above that we did not actively chase the AI trade. But we suspect that the technology holdings that performed so exceptionally in the R2KV Index were explicit beneficiaries of the AI trade. As always, we follow our process and remain agnostic to what the benchmark is doing.
One final note on our technology holdings. We have been turning over rocks, but we haven’t purchased any beaten up SaaS companies. At moments of fear and panic, we try to simplify and judge if the disruption will continue to be an issue in three to five years. In the case of tariffs, we were pretty sure that our companies would adapt and the world would move on. This is decidedly not the case for AI, which only seems to be getting more capable with each successive model. We don’t know how it will turn out for incumbent software companies, but the world has changed and the range of outcomes seems outrageously wide. Yet valuations, which have declined meaningfully, are still quite full on an owner’s earnings basis (with the appropriate expensing of stock compensation). Many smarter people than we are trying to figure out SaaS. We will stick to our process and continue turning over rocks.
Portfolio Commentary
In Q2 we added three new positions. Vontier (VNT) manufactures tanks, pumps and payment systems for gas stations. The company was a 2021 spinoff from Fortive, which itself was the spinoff of Danaher’s lower growth industrial assets. Since 2021, Vontier has been dealing with headwinds following a pull forward of sales from changing payment standards (EMV) and reorganizing the disparate collection of businesses that were originally acquired by Danaher. At their November 2025 Investor Day, Vontier made the cogent argument that they benefit from potential sales to the growing convenience store end market. We believe that shares are attractively priced at roughly 9x earnings.
The Bank of N.T. Butterfield and Sons (NTB) owns attractive deposit and wealth management franchises in the Caribbean financial centers of Cayman and Bermuda. The bank has a very attractive return on equity despite investing in low risk assets. On May 28, Butterfield announced a deal to acquire CIBC’s Caribbean franchises for 1.1x book and 9x earnings, roughly doubling the size of the business.12 The deal will provide some growth and further consolidate Butterfield’s attractive Caribbean markets but adds some operational and balance sheet risk. Still, Butterfield remains a well-run banking franchise and were pleased to be able to accumulate shares at less than 10x earnings.
Unitil (UTL) is a well run and diversified utility serving Maine, New Hampshire and Northern Massachusetts. These are attractive regulatory jurisdictions and the company does a good job converting investments in their rate base into GAAP earnings. Unitil is also making attractive acquisitions – Bangor Gas, Maine Natural Gas and two water utilities in New Hampshire and Maine for the price of roughly 1.25x rate base. The company believes that it can continue to grow EPS at a 5% – 7% clip, in line with their history. Our enthusiasm for the shares is only tempered by the company’s small size and limited liquidity.
We made significant additions to our holding in JBT Marel (JBTM) and UGI Corp (UGI).13 JBT Marel manufactures food processing equipment and has a history of impressive earnings consistency and growth in a relatively non-cyclical end market. UGI, a regulated gas utility serving Pennsylvania and West Virginia, also owns a collection of pipelines and unregulated propane distribution businesses in the U.S. and Europe. We think the company has done an impressive job resetting after problems in their Amerigas propane business led to an increase in their debt metrics. Shares were available at an attractive price of ~11x earnings.
We made significant reductions to our holdings in Fabrinet (FN), Vishay Intertechnology (VSH) and Synaptics (SYNA). All three have appreciated significantly over the past year. Fabrinet makes optical networking equipment and their datacenter business has grown to roughly half of sales. Vishay makes passive components and discrete semiconductors. Performance has rebounded aggressively from cyclical lows of a year ago. Synaptics, a manufacturer of chips for internet of things (IoT) and edge processing, agreed to be acquired by ON Semi (ON) in an all stock deal on June 25.14 We made additional trims to our positions in Littelfuse (LFUS) and TD Synnex (SNX) which had also appreciated significantly in the quarter.
Finally, CSG Systems (CSGS) was acquired by NEC on May 15 and exited the portfolio.15
At quarter end, our cash position was 10.2%.
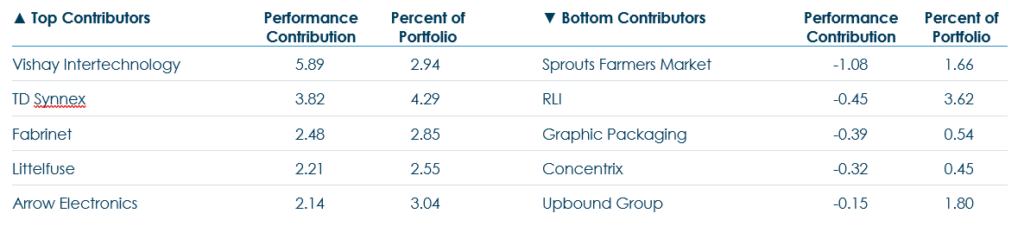
Trailing Twelve Month Top and Bottom Contributors (%)16
Top Contributors
- Vishay Intertechnology (VSH) makes passive electronic components and discrete semiconductors (resistors, inductors, capacitors, MOSFETs, diodes, etc). Although the industry is cyclical, competitive dynamics are stable and VSH benefits from incremental growth from electric vehicles and industrial electrification. A year ago, the industry was struggling from a cyclical downturn following the excesses and component hoarding of the Covid era. The stock declined again when President Trump announced his tariffs in April 2025. But the industry has come roaring back; VSH’s Q1 earnings release on May 13 announced a year-over-year sales increase of 17%, strength across all end markets and distribution channels, and a book-to-bill ratio of 1.34.17 Vishay is also incrementally selling to data centers. We believe the stock may have gotten caught up in the “AI trade” and have aggressively reduced our position.
- TD Synnex (SNX) is the largest IT distributor globally. The company has done a good job diversifying away from its historical position in hardware (PCs, peripherals, servers, networking equipment, etc.) and into software, security and services. TD Synnex is modestly levered and uses its cash flow to repurchase shares and pay dividends. On Mar 31, the company reported blow out earnings and provided financials for Hyve, its data center business.18 Hyve is growing billings at a nearly 100% annualized rate and is on track to contribute ~$700m of operating earnings this year. These numbers were higher than investors anticipated and the stock has performed very well since their release. We think that TD Synnex is exceptionally well run, has scale and scope advantages versus smaller competitors and that profits will continue to grow with IT spending at a GDP+ rate. We have trimmed our position, but SNX trades at roughly 13x forward earnings and continues to be a top 5 holding for the Fund.
- Fabrinet (FN) is a contract manufacturer that specializes in optical networking equipment and modules. This is complex work at small scales, and Fabrinet dominates its niche. The company has experienced impressive historical revenue growth and increased operating margins. Fabrinet’s highest bandwidth products are finding increasing demand in data centers, especially those data centers used to train artificial intelligence models. In 2023, Fabrinet disclosed that Nvidia is a 10% customer. FN’s stock price roughly doubled from last year on rising expectations for data center spending. We believe such spending, as capitalized in FN’s stock price, may have gotten ahead of itself and have been trimming. But the need for high bandwidth networking will continue, Fabrinet dominates its core telecom and data center markets and has prudently diversified into a handful of other niches that reward precise assembly at small scale. We continue to hold a small position in Fabrinet.
- Littelfuse (LFUS) manufactures niche electrical components including fuses, sensors, passives and semiconductors that are sold into a broad array of end markets. Mid-single digit organic growth is supplemented by tuck in acquisitions and the company has high teens operating margins and strong returns on capital. We significantly added to our position in April 2025 when the stock declined on tariff fears. Since then, LFUS’s share price has more than doubled as the company demonstrated it could navigate tariffs, sales and orders accelerated out of their post-Covid trough, and the company recorded incremental sales into data centers.
- Arrow Electronics (ARW) distributes a broad array of semiconductors. Arrow is larger with better financials than its closest competitor Avnet (AVT) and these companies produce a lot of cash despite some cyclicality. Arrow used its strong cash flows during the Covid component shortages (2020 through 2023) to retire roughly one-third of its outstanding shares. A year ago, Arrow was suffering from a cyclical trough and the Trump tariffs. But the industry has come roaring back and in its Q1 earnings release on May 7, ARW reported 39% YoY earnings growth and more than doubled its adjusted EPS.19 We have been trimming our position, but the stock trades at ~10x forward earnings and we still hold a substantial position.
Bottom Contributors
- Sprouts Farmers Market (SFM) is a supermarket chain focusing on fresh, natural, and organic products. The company has strong operating margins, attractive returns on capital, and excellent new store economics. Through April 2025, SFM’s stock performed extremely well in concert with strong revenue growth and rising earnings estimates. As SFM’s valuation increased, we trimmed our position in late 2024 and early 2025. Then, when growth slowed in the second half of 2025, SFM’s share price collapsed. Today, SFM trades at a low-teens multiple of forward earnings and we are comfortable holding a mid-sized position.
- RLI Corp (RLI) is a specialty property and casualty insurer. The company is extremely selective in writing business. Its diversified lines include niche-y areas such as school buses, Hawaii homeowners, and surety. RLI’s unique culture, incentive structures and willingness to walk away from unprofitable business have historically led to exceptional financial performance. From 2015 through 2024, the company’s combined ratio averaged 89.3% and its ROE averaged 16.6% despite being weighed down by excess capital.20 We have owned RLI since 2011 and the stock usually commands a premium valuation. We were pleased to be able to add to our position at roughly 20x this year’s earnings.
- Concentrix (CNXC) is one of two top customer experience (CX) vendors globally. The company began by managing call centers but has since evolved into a high-tech business process outsourcer (BPO) that also designs and runs customer-facing websites and apps, integrates the data, and optimizes a client’s customer interactions. The March, 2023 acquisition of WebHelp helped consolidate the industry but left the company with roughly three turns of debt. Over the past two years, growth and margins have declined, and the market is concerned that Concentrix’s core businesses are being disrupted by AI. We are encouraged by increasing demand for the companies iX Suite product which integrates AI across their broad portfolio of offerings. The company trades at very low valuation multiples, but we share the market’s concern and currently hold less than 50 bps of CNXC.
- Graphic Packaging (GPK) is a vertically integrated paper packaging manufacturer with plants in the U.S. and Europe. The company is suffering from a combination of weak industry fundamentals, massive cost overruns at its new Waco, TX recycled paperboard plant, and too much debt. In October, CFO Stephen Scherger left to join Amcor and then in December, long-time CEO Mike Doss left under acrimonious circumstances.21 Although this is a riskier position in the portfolio we are encouraged by GPK’s product offerings focused on the current plastic to paper trend in consumer and retail packaging. We currently hold a less than 50 bp position in GPK.
- Upbound Group (UPBD) lends to sub-prime consumers in two primary segments: Rent-a-Center, which focuses on furniture and appliances through physical stores; and Acima, which offers last-look financing through associated retailers including electronics and tire shops (“Buy Now Pay Later”). Sub-prime consumers are struggling but Upbound’s operating results remain stable. The company has been slow to de-lever after purchasing Acima in 2021 and made another incremental acquisition on Jan. 31, 2025 when it bought Brigit, an app that charges subscription fees to access payday lending. UPBD’s stock is cheap at less than five times earnings. But we have been slow to add given the company’s leverage and concerns regarding the Buy Now Pay Later segment.
Conclusion
We are focused on the long-term fundamental performance of our investments not short-term market performance. We avoid making predictions about market direction, but are confident about the Fund’s long-term prospects and will continue to manage our portfolio with diligence, discipline, and patience.
As always, and as significant co-investors in the Fund, we appreciate your trust in us to be good stewards of your capital. If you would like to discuss performance or the Fund’s portfolio holdings in greater detail, please let us know.
Respectfully,
Steve Scruggs, CFA, Portfolio Manager
Ben Mellman, Portfolio Manager
July 20, 2026
1 As of June 30, 2026. Source: Morningstar Direct, FPA. Data shown for the FPA Queens Road Small Cap Value Fund – Investor Class (“Fund”). Inception of the Fund was June 13, 2002. The periods referenced above reflect Russell 2000 Value drawdowns 20% or greater and are calculated from that index’s peak and trough dates, (i.e., 6/28/2002-10/9/2002, 6/4/2007-3/9/2009, 6/23/2015-2/11/2016, 8/22/2018-3/23/2020, 11/8/2021-10/27/2023, 11/25/2024-4/8/2025). Please see page 1 for net performance of the Fund since inception. Please also see the end of this commentary for Important Disclosures and Definitions of Key Terms.
2 Source: FPA
3 Source: Morningstar
4 Source: LSEG Datastream and Yardeni research. Time-weighted average of consensus estimates for current year and next year.
5 Source: https://www.yardeniquicktakes.com/us-market-call-is-irrational-exuberance-driving-femo/
6 Source: Factset
7 Source: Factset
8 As of June 30, 2026, For their most recent fiscal years, TD Synnex had revenue of $62.5B while no. 2 Ingram Micro had revenue of $52.0B. No. 3 is Arrow Electronics reporting $30.9B in total revenue for December 2025, with ECS business up 18% in revenue from $7.9B reported in December 2024. At the time of this presentation, TD Synnex most recently reported fiscal year ended November 2025. Ingram Micro and Arrow Electronics most recently reported fiscal year ended December 2025.
9 Source: https://ir.tdsynnex.com/news/news-details/2026/TD-SYNNEX-Reports-Record-Fiscal-2026-Second-Quarter-Results/default.aspx
10 Source: https://investor.synaptics.com/news-releases/news-release-details/synaptics-and-google-collaborate-edge-ai-iot
11 Source: https://investor.synaptics.com/news-releases/news-release-details/onsemi-acquire-synaptics-enable-next-generation-intelligent
12 Source: https://www.butterfieldgroup.com/insights-news/news/butterfield-announces-agreement-acquire-control-cibc-caribbean-18-billion
13 We define a significant addition as increasing our holdings by 33% or more in positions where we have a portfolio weight of at least 1% at the previous quarter end
14 Source: https://www.synaptics.com/company/news/onsemi-to-acquire-synaptics-to-enable-the-next-generation-of-intelligent-systems-for-physical-ai#:~:text=%26%20SAN%20JOSE%2C%20Calif.,value%20of%20approximately%20%247%20billion.
15 Source: https://www.nec.com/en/press/202605/global_20260515_01.html
16 Reflects the top contributors and top detractors to the Fund’s performance based on preliminary contribution to return for the trailing twelve months (TTM) period ending June 30, 2026. Contribution is presented gross of investment management fees, transactions costs, and Fund operating expenses, which if included, would reduce the returns presented. Portfolio weights represent the average weights over the periods noted. A copy of the methodology used and a list of every holding’s contribution to the overall Fund’s performance during the quarter to date (QTD) and year to date (YTD) is available by contacting [email protected]. It should not be assumed that recommendations made in the future will be profitable or will equal the performance of the securities listed. Totals may not sum due to rounding. Note: June 30, 2026 company descriptions were developed by the investment team and unless otherwise noted reflect the most recent data made available by the companies or third-party research firms the investment team believe to be reliable.
17 Source: https://ir.vishay.com/financial-information/quarterly-results
18 Source: https://ir.tdsynnex.com/financials/quarterly-results/default.aspx
19 Source: https://investor.arrow.com/investors/default.aspx
20 Source: RLI 10-Ks, presentations and earnings calls, FPA Queens Road Funds interpretation and adjustments; https://investors.rlicorp.com/overview/default.aspx
21 Source: https://www.packagingdive.com/news/graphic-packaging-international-ceo-ouster-reversal-eminence-capital-shareholder-board/808358/
Important Information
This Commentary is for informational and discussion purposes only and does not constitute, and should not be construed as, an offer or solicitation for the purchase or sale of any securities, products or services discussed, and neither does it provide investment advice. Any such offer or solicitation shall only be made pursuant to the Fund’s Prospectus, which supersedes the information contained herein in its entirety. This Commentary does not constitute an investment management agreement or offering circular.
The statements contained herein reflect the opinions and views of the portfolio managers as of the date written, is subject to change without notice, and may be forward-looking and/or based on current expectations, projections, and/or information currently available. Such information may not be accurate over the long-term. These views may differ from other portfolio managers and analysts of the firm as a whole and are not intended to be a forecast of future events, a guarantee of future results or investment advice.
Portfolio composition will change due to ongoing management of the Fund. References to individual securities or sectors are for informational purposes only and should not be construed as recommendations by the Fund, the portfolio manager, the Adviser, the Sub-Adviser or the distributor. It should not be assumed that future investments will be profitable or will equal the performance of the security or sector examples discussed. The portfolio holdings as of the most recent quarter-end may be obtained at fpa.com.
Future events or results may vary significantly from those expressed and are subject to change at any time in response to changing circumstances and industry developments. The information and data contained herein has been prepared from sources believed reliable, but the accuracy and completeness of the information cannot be guaranteed and is not a complete summary or statement of all available data.
The information contained herein is not complete, may change, and is subject to, and is qualified in its entirety by, the more complete disclosures, risk factors, and other information contained in the Fund’s Prospectus and Statement of Additional Information. The information is furnished as of the date shown. No representation is made with respect to its completeness or timeliness. The information is not intended to be, nor shall it be construed as, investment advice or a recommendation of any kind.
Certain statements contained in this presentation may be forward-looking and/or based on current expectations, projections, and information currently available. Actual events or results may differ from materially those we anticipate, or the actual performance of any investments described herein may differ from those reflected or contemplated in such forward-looking statements, due to various risks and uncertainties. We cannot assure future results and disclaim any obligation to update or alter any forward-looking statements, whether as a result of new information, future events, or otherwise. Such statements may or may not be accurate over the long-term. Statistical data or references thereto were taken from sources which we deem to be reliable, but their accuracy cannot be guaranteed.
The reader is advised that the Fund’s investment strategy includes active management with corresponding changes in allocations from one period of time to the next. Therefore, any data with respect to investment allocations as of a given date is of limited use and may not be reflective of the portfolio manager’s more general views with respect to proper geographic, instrument and /or sector allocations. The data is presented for indicative purposes only and, as a result, may not be relied upon for any purposes whatsoever.
In making any investment decision, you must rely on your own examination of the Fund, including the risks involved in an investment. Investments mentioned herein may not be suitable for all recipients and in each case, potential investors are advised not to make any investment decision unless they have taken independent advice from an appropriately authorized advisor. An investment in any security mentioned herein does not guarantee a positive return as securities are subject to market risks, including the potential loss of principal. You should not construe the contents of this document as legal, tax, investment or other advice or recommendations.
Fund performance presented is calculated on a total return basis, which includes the reinvestment of all income, plus realized and unrealized gains/losses, if applicable. Unless otherwise indicated, performance results are presented on a net of fees basis and reflect the deduction of, among other things: management fees, brokerage commissions, operating and administrative expenses, and accrued performance fee/allocation, if applicable.
The information provided in this presentation is based upon data existing as of the date(s) of the report and has not been audited or reviewed. While we believe the information to be accurate, it is subject in all respects to adjustments that may be made after proper review and reconciliation.
Investments carry risks and investors may lose principal value. Capital markets are volatile and can decline significantly in response to adverse issuer, political, regulatory, market, or economic developments. Securities of smaller, less well-known companies involve greater risks and they can fluctuate in price more than larger company securities. You risk paying more for a security than you received from its sale.
The Fund primarily invests in equity securities (common stocks, preferred stocks and convertible securities) of small-capitalization U.S. companies, defined as those with market-capitalization, at the time of purchase, that is no greater than the largest market-capitalization of any company included in the Russell 2000 Index. Investing in small companies involves special risks including, but not limited to, the following: smaller companies typically have more risk and their company stock prices are more volatile than that of large companies; their securities may be less liquid and may be thinly traded which makes it more difficult to dispose of them at prevailing market prices; these companies may be more adversely affected by poor economic or market conditions; they may have limited product lines, limited access to financial resources, and may be dependent on a limited management group; and small-cap stocks may fluctuate independently of large-cap stocks. All investment decisions are made at the discretion of the Portfolio Manager, in accordance with the then current Prospectus. Comparison to any index is for illustrative purposes only.
The prices of securities held by the Fund may decline in response to certain events taking place around the world, including those directly involving the companies whose securities are owned by the Fund. Securities in the Fund’s portfolio may underperform due to inflation (or expectations for inflation), interest rates, global demand for particular products or resources, natural disasters, pandemics, epidemics, terrorism, regulatory events and governmental or quasi-governmental actions. There is a risk that you may lose money by investing in the Fund.
Value style investing presents the risk that the holdings or securities may never reach their full market value because the market fails to recognize what the portfolio management team considers the true business value or because the portfolio management team has misjudged those values. In addition, value style investing may fall out of favor and underperform growth or other styles of investing during given periods.
Please refer to the Fund’s Prospectus for a complete overview of the primary risks associated with the Fund.
©2026 Morningstar, Inc. All Rights Reserved. The Morningstar information contained herein: (1) is proprietary to Morningstar and/or its content providers; (2) may not be copied or distributed; and (3) is not warranted by Morningstar to be accurate, complete, or timely. Neither Morningstar nor its content providers are responsible for any damages or losses arising from any use of this information. Past performance is no guarantee of future results.
The FPA Funds are distributed by Distribution Services, LLC. 190 Middle Street, Suite 301, Portland, ME 04101. Distribution Services, LLC and FPA are not affiliated.
Index Definitions
Comparison to any index or benchmark is for illustrative purposes only and should not be relied upon as a fully accurate measure of comparison. The Fund may be less diversified than the indices noted herein and may hold non-index securities or securities that are not comparable to those contained in an index. Indices will hold positions that are not within the Fund’s investment strategy. Indices are unmanaged and do not reflect any commissions, transaction costs, or fees and expenses which would be incurred by an investor purchasing the underlying securities and which would reduce the performance in an actual account. You cannot invest directly in an index.
The Russell 2000 Index measures the performance of the small-cap segment of the U.S. equity universe. It is a market cap weighted index that includes the smallest 2,000 companies covered in the Russell 3000 universe of United States-based listed equities.
The Russell 2000 Value Index measures the performance of the small-cap value segment of the U.S. equity universe. It includes those Russell 2000 companies that are considered more value oriented relative to the overall market as defined by Russell’s leading style methodology.
Standard & Poor’s 500 Stock Index (S&P 500) is a-capitalization-weighted index which covers industrial, utility, transportation and financial service companies, and represents approximately 75% of the New York Stock Exchange (NYSE) capitalization and 30% of NYSE issues. The S&P 500 is considered a measure of large-capitalization stock performance.
Standard & Poor’s 600 Stock Index (S&P 600) is an index of small-cap stocks managed by Standard & Poor’s. It tracks a broad range of small-sized companies that meet specific liquidity and stability requirements. This is determined by specific metrics such as public float, market capitalization, and financial viability, among other factors.
Small-cap Value Companies: The term small-cap describes companies with a relatively small market-capitalization. A company’s market-capitalization is the market value of its outstanding shares. The definition for small-cap varies, but generally means a company with $300 million to $2 billion in market-capitalization.
Glossary of Terms
Compounders: High quality companies the Fund hopes to own forever. The two most important quality metrics are earnings consistency and returns on invested capital. Quality means the Fund can have confidence that a business will create shareholder value over the long-term.
Downside-capture ratio is used to evaluate how well an investment manager performed relative to an index during periods when that index has fallen. The ratio is calculated by dividing the manager’s returns by the returns of the index during the down market, and multiplying that factor by 100. BPS or basis points; 1 bps is equal to 0.01%.
Earnings per share (EPS) is calculated as a company’s profit divided by the outstanding shares of its common stock.
Expected earnings are an estimate for a company’s future quarterly or annual earnings per share (EPS).
Forward earnings are an estimate of the next period’s earnings of a company, usually through the completion of the current fiscal year and sometimes to the following fiscal year.
Free Cash Flow represents the cash a company can generate after required investment to maintain or expand its asset base.
Margin of Safety – Buying with a “margin of safety” is when a security is purchased at a discount to the portfolio manager’s estimate of its intrinsic value. Buying a security with a margin of safety is designed to protect against permanent capital loss in the case of an unexpected event or analytical mistake. A purchase made with a margin of safety does not guarantee the security will not decline in price.
Market Cycle Performance is defined as a period that contains a decline of at least 20% from the previous market peak over at least a two-month period and a rebound to establish a new peak above the prior market peak.
Price/Earnings Ratio (P/E) is the price of a stock divided by its earnings per share. Percentages are based on the absolute number of shares. P/E ex-Neg EPS is Price/Earnings ex negative earnings per share. P/E, average P/E, or P/E (trailing) is based on the last 12 months of actual earnings. P/E, next 12 months or P/E (forward) utilizes forward earnings expectations over the next 12 months to calculate the ratio.
Return on Equity (ROE) measures a corporation’s profitability by revealing how much profit a company generates with the money shareholders have invested.