
You should consider the Fund’s investment objectives, risks, and charges and expenses carefully before you invest. The Prospectus details the Fund’s objective and policies, charges, and other matters of interest to a prospective investor. Please read the Prospectus carefully before investing. The Prospectus may be obtained by visiting the website at fpa.com, by email at [email protected], toll-free by calling 1-800-982-4372 or by contacting the Fund in writing.
Average Annual Total Returns (%)
| As of June 30, 2026 | Since Inception* | 40 Yr | 30 Yr | 20 Yr | 15 Yr | 10 Yr | 5 Yr | 3 Yr | 1 Yr | YTD | QTD |
|---|---|---|---|---|---|---|---|---|---|---|---|
| FPA New Income (FPNIX) | 6.15 | 5.38 | 3.89 | 2.84 | 2.40 | 2.97 | 3.33 | 5.89 | 3.48 | 0.54 | 0.36 |
| Bloomberg U.S. Aggregate | 6.19 | 5.33 | 4.28 | 3.32 | 2.28 | 1.54 | 0.08 | 4.16 | 3.79 | 0.62 | 0.67 |
| CPI + 100 | 3.85 | 3.85 | 3.57 | 3.56 | 3.67 | 4.34 | 5.25 | 4.07 | 4.50 | 2.51 | 0.94 |
| Bloomberg U.S. Govt/Credit 1-5 Yr | 5.19 | 5.19 | 4.61 | 3.60 | 2.73 | 1.90 | 1.96 | 1.73 | 4.68 | 3.00 | 0.52 |
| Bloomberg U.S. Aggregate 1-3 Yr | – | – | – | 2.44 | 1.71 | 1.99 | 2.15 | 4.69 | 3.23 | 0.82 | 0.49 |
Inception date was July 11, 1984. Index data source: Morningstar.
Past performance is no guarantee of future results and current performance may be higher or lower than the performance shown. This data represents past performance and investors should understand that investment returns and principal values fluctuate, so that when you redeem your investment it may be worth more or less than its original cost. Current month-end performance data, which may be higher or lower than the performance data quoted, may be obtained at fpa.com or by calling toll-free, 1-800-982-4372. As of its most recent prospectus, the Fund’s total expense ratio is 0.59% for the Institutional Class and 0.77% for the Investor Class and net expense ratio is 0.45% for the Institutional Class and 0.55% for the Investor Class.
Periods greater than one year are annualized. FPA New Income Fund (“Fund”) performance reflects the Institutional Class and is calculated on a total return basis which includes reinvestment of all distributions and is net of all fees and expenses. Fund returns do not reflect the deduction of taxes that a shareholder would pay on Fund distributions or the redemption of Fund shares, which would lower these figures. Comparison to any index is for illustrative purposes only. The Fund does not include outperformance of any index or benchmark in its investment objectives. An investor cannot invest directly in an index.
The Fund’s Total Annual Fund Operating Expenses before reimbursement (as of the most recent prospectus) is 0.59% for the Institutional Class and 0.77% for the Investor Class. First Pacific Advisors, LP (“FPA” or the “Adviser”) has contractually agreed to reimburse the Fund for Total Annual Fund Operating Expenses (excluding interest, taxes, brokerage fees and commissions payable by the Fund in connection with the purchase or sale of portfolio securities, and extraordinary expenses, including litigation expenses not incurred in the Fund’s ordinary course of business) in excess of 0.454% of the average daily net assets of the Institutional Class shares of the Fund through January 31, 2027, and in excess of 0.554% of the average daily net assets of the Investor Class shares of the Fund through January 31, 2027. This agreement may only be terminated earlier by the Fund’s Board of Trustees (the “Board”) or upon termination of the Advisory Agreement.
In addition, the Adviser has voluntarily agreed to waive the advisory fee it receives from the Fund by 0.046% through January 31, 2027 of the Fund’s average daily net assets. FPA will not seek recoupment of the advisory fees voluntarily waived.
Please see important disclosures at the end of this commentary.
Dear Shareholder:
FPA New Income Fund (the “Fund”) returned 0.36% in the second quarter of 2026.
| 6/30/2026 | |
|---|---|
| Yield-to-worst1 | 4.35% |
| Effective Duration | 3.23 Years |
| Spread Duration | 1.82 Years |
| High Quality Exposure2 | 97% |
| Credit Exposure3 | 3% |
¹ As of June 30, 2026, the Fund’s subsidized/unsubsidized 30-day SEC standardized yield (“SEC Yield”) was 3.62%/3.49% respectively. The SEC Yield calculation is an annualized measure of the Fund’s dividend and interest payments for the last 30 days, less the Fund expenses. Subsidized yield reflects fee waivers and/or expense reimbursements during the period. Without waivers and/or reimbursements, yields would be reduced. Unsubsidized yield does not adjust for any fee waivers and/or expense reimbursements in effect. The SEC Yield calculation shows investors what they would earn in yield over the course of a 12-month period if the fund continued earning the same rate for the rest of the year.
Yield-to-worst (“YTW”) is presented gross of fees and reflects the lowest potential yield that can be received on a debt investment without the issuer defaulting. YTW considers the impact of expected prepayments, calls and/or sinking funds, among other things. Average YTW is based on the weighted average YTW of the investments held in the Fund’s portfolio. YTW may not represent the yield an investor should expect to receive.
2 High Quality is defined as investments rated A or higher, Treasuries, and cash and equivalents.
3 Credit is defined as investments rated BBB or lower, including non-rated investments.
During the second quarter of 2026, the Federal Reserve left the federal funds rate unchanged at both its April and June meetings. Notably, the June meeting was the first for the new Fed Chair, Kevin Warsh. Under Warsh, the Federal Reserve published a June policy statement that was more brief than past statements and eliminated the forward guidance that had become a staple of Federal Reserve communications. The June statement also reaffirmed the Fed’s commitment to price stability, which Warsh emphasized during his post-meeting press conference. In the wake of the June meeting, yields increased as the bond market expected tighter monetary policy going forward. Treasury yields were also affected during the quarter by developments in the United States’ war with Iran. Yields on one- to five-year maturity Treasuries increased by 28-38 bps during the quarter. Spreads on investment grade and high yield debt decreased during the quarter, leaving both in historically expensive territory. Due to low spreads, we remain focused on buying longer-duration, High Quality bonds (rated single-A or higher) that we believe will enhance both the Fund’s long-term returns and short-term upside-versus-downside return profile. We seek to opportunistically invest in Credit when we believe prices adequately compensate for the risk of permanent impairment of capital and near-term mark-to-market risk. We did not generally view Credit (investments rated BBB or lower) as attractively priced during the quarter. The Fund’s Credit exposure was 3.2% on June 30, 2026 versus 3.3% on March 31, 2026. Cash and equivalents represented 6.8% of the portfolio on June 30, 2026 versus 6.2% on March 31, 2026.
2Q 2026 Contributors and Detractors4
| ▲ Top contributors | Notable drivers of return |
|---|---|
| Corporates | Common stock price appreciation and interest income |
| Cash and equivalents | Interest income |
| Equipment ABS | Interest income, partially offset by price declines caused by an increase in benchmark yields |
| ▼ Top detractors | Notable drivers of return |
|---|---|
| Treasuries | Price decrease caused by an increase in benchmark yields, partially offset by interest income |
4 It should not be assumed that an investment in the securities mentioned was or will be profitable. The Fund’s full list of holdings as of June 30, 2026 can be found at https://fpa.com/wp-content/uploads/FPA-New-Income-Fund-Holdings-2026-06.pdf. The information provided does not reflect all positions purchased, sold or recommended by FPA during the quarter.
Although certain individual bonds detracted from performance during the quarter, there were no other meaningful detractors at the sector level.
Portfolio Activity5
The tables below provide an overview of the portfolio as of June 30, 2026 and March 31, 2026:
| 6/30/2026 | 3/31/2026 | ||
|---|---|---|---|
| Yield-to-worst1 | 4.35% | 4.24% | |
| Effective Duration | 3.23 years | 3.33 years | |
| Spread Duration | 1.82 years | 1.98 years | |
| Average Life | 3.63 years | 3.74 years |
| 6/30/2026 | 3/31/2026 | ||
|---|---|---|---|
| Sector Exposure (% of portfolio) | |||
| ABS | 21.2 | 22.4 | |
| CLO | 2.4 | 2.8 | |
| Corporate | 3.2 | 3.2 | |
| Agency CMBS | 11.3 | 11.5 | |
| Non-Agency CMBS | 2.4 | 2.4 | |
| Agency RMBS | 15.6 | 16.3 | |
| Non-Agency RMBS | 5.5 | 5.8 | |
| Stripped Mortgage-backed | 0.2 | 0.2 | |
| U.S. Treasury | 31.5 | 29.1 | |
| Cash and equivalents | 6.8 | 6.2 | |
| Total | 100.0 | 100.0 |
5 Portfolio composition will change due to ongoing management of the Fund.
Past performance is no guarantee, nor is it indicative, of future results.
As discussed in more detail below, while risk-free rates remain at attractive levels, spreads are in historically low territory, leading us to invest in longer duration High Quality bonds.
Below is a summary of our investment activity during the quarter, in which we:
- Extended the duration of our existing Treasury holdings
- Sold asset-backed securities (“ABS”) with a weighted average life and duration of 1.9 years and 1.6 years, respectively.
- Bought 5-year maturity Treasury Inflation Protected Securities (“TIPS”)
- Bought High Quality bonds with a weighted average life and duration of 4.7 years and 4.2 years, respectively, including:
- Treasuries
- ABS backed by equipment
We did not make any Credit investments during the quarter.
As noted above, we initiated a new position in five-year maturity TIPS during the quarter. Like a typical Treasury bond which is known as a nominal Treasury (“Treasury”), TIPS are backed by the full faith and credit of the United States government. Treasuries pay a fixed rate of interest on a fixed principal balance. TIPS also pay a fixed rate of interest but on a principal balance that grows at the rate of inflation (or shrinks at the rate of deflation). The yield on a Treasury (referred to as the nominal yield) can simplistically be broken down into two pieces – a real yield over the life of the Treasury plus the expected inflation over the life of the Treasury. In other words, when buying a Treasury, one is buying a fixed real yield and fixed amount of inflation. To the extent that real yields and/or expected inflation change during the five-year life of a Treasury, the nominal yield and thus the dollar price of the Treasury will change. On the other hand, the real yield of TIPS is fixed and the inflation component of the TIPS future return will “float” based on actual inflation over time. As a result, the dollar price of TIPS will respond to changes in real yield.
Looking backward, actual inflation over a five-year period can differ from the inflation that was expected at the beginning of the five-year period. Over the life of a Treasury, if actual inflation is higher than the inflation expected at the time of the Treasury investment, then the total real return over the life of the Treasury will be less than the real yield at purchase. In comparison, over the five-year life of the TIPS, the realized real return should be similar to the real yield at purchase, regardless of actual inflation over those five years. It stands to reason then that one might want to buy TIPS if one has a view that actual inflation will be higher than the expected inflation that is embedded in the yield of the Treasury. As an example, at June 30, the nominal yield on the 5-year nominal Treasury was 4.23%. The real yield on the 5-year TIPS was 1.95%. The implied inflation expected over the next five years was 4.23% less 1.95%, or 2.28%. If one had a view that inflation over the next five years would be greater than 2.28%, it may make sense to buy TIPS instead of Treasuries and vice versa.
So what is our view on inflation? It should surprise no one that we do not have a view on inflation. We have written many times before that macroeconomic and market predictions do not drive our investing process because we believe investing in that manner is a low conviction way to produce attractive long-term risk-adjusted returns. How then did we choose to buy TIPS? It’s quite simple: at our purchase prices, we found that TIPS offered an attractive absolute return over a range of real interest rate and inflation scenarios in the short (12 months) and long (5 years) term. In the short-term, TIPS may produce an attractive positive absolute return while underperforming a Treasury in some scenarios (think very low inflation and very low real interest rates) but may alternatively produce an attractive positive return and outperform a Treasury in other scenarios (think elevated inflation and rising real interest rates). Further, consistent with our investment process, even when assuming very low inflation, we believe we purchased TIPS at prices that would produce at least a breakeven return over twelve months if real interest rates were to increase by 100 bps during that time. In short, much like our prior investments in Treasuries and our investments in any other type of debt, when considering what could happen in the future, we believe the TIPS offered an attractive upside-versus-downside and attractive long-term return without taking a view on what will happen in the future.
Our recent investment in TIPS is representative of our flexible and opportunistic investment approach. The last time the Fund owned TIPS was nearly 20 years ago. Since then, we have looked at TIPS many times but either the absolute short- and long-term return profile was not attractive to us or there were other uses of capital we believed had more attractive absolute return profiles. At June 30, 2026, 5-year real yields increased to levels last seen in 2022-2024. Due to higher spreads in 2022-2024, there were other uses of capital (mortgages, ABS, corporates, etc.) we believed would be more likely to maximize the return on that capital while also satisfying our desire for an expected return of capital. In the second quarter of 2026, with spreads in historically low territory, TIPS became an attractive use of capital.
Observations
Risk-free rates remain high but the price of credit risk appears very expensive. That has led us to build a portfolio we believe has little credit risk with a relatively long duration (in comparison to other funds in the Morningstar Short-Term Bond category). That’s an easy position for us to get to. Read on to learn how we got there.
Spread measures the compensation debt investors receive for an uncertain return profile. Treasuries are considered the “risk-free” asset because the market views it as a certainty (or near certainty) that Treasuries will be repaid in full at maturity with no possibility of prepayment, extension of payment or haircut to the amount owed (at least in nominal terms). In comparison, almost everything else with a similar expected maturity bears a higher yield than Treasuries because other types of debt may possibly be repaid early, late, or not at all. That difference in yield versus Treasuries is the spread.
A big driver of whether and when debt is repaid (in addition to call or extension features) is the credit quality of the borrower. Viewed through that lens, spread can be seen as the compensation that debt investors receive for taking on credit risk – the risk that a borrower will not repay debt in full and/or by maturity. Over the past few months, spreads have decreased into historically low territory. In other words, the compensation for credit risk has decreased into historically low territory.
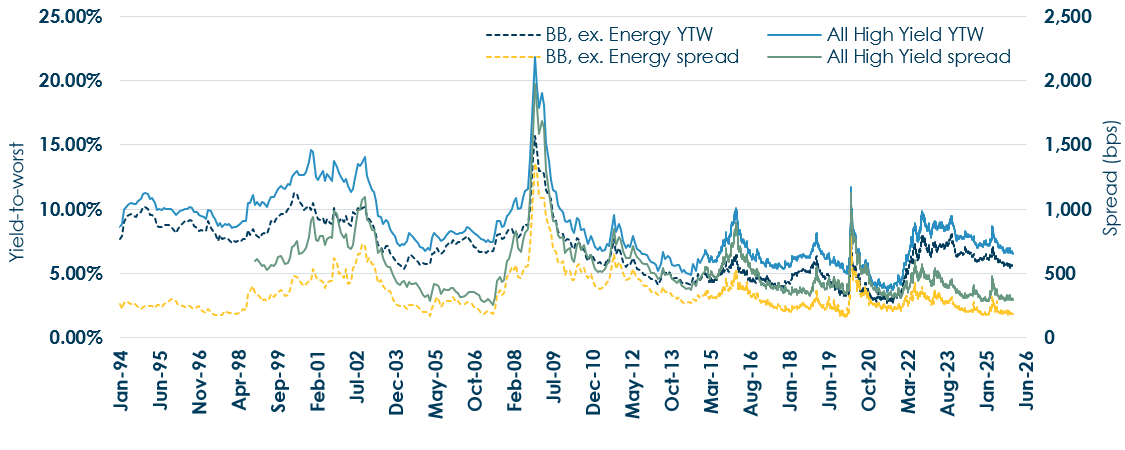
The chart and table below show yields and spreads on the Bloomberg U.S. Corporate High Yield Index and the BB component of that index, excluding energy. The latter is a measure of the high yield market that we believe provides a more consistent price comparison over time due to changes in the composition of the high yield market. Spreads in the high yield market ended the quarter at the fourth percentile (a lower percentile indicates a more expensive market, i.e., the compensation for credit risk is low). Said another way, historically 96% of the time spreads have been higher than they were at June 30.
Bloomberg U.S. Corporate High Yield Index
| Spread | Percentile | |
|---|---|---|
| All High Yield | 297 bps | 4% |
| BB, ex. Energy | 183 bps | 4% |
Source: Bloomberg. As of June 30, 2026. YTW is Yield-to-Worst. Spread reflects the quoted spread of a bond that is relative to the security off which it is priced, typically an on-the-run Treasury. For illustrative purposes only.
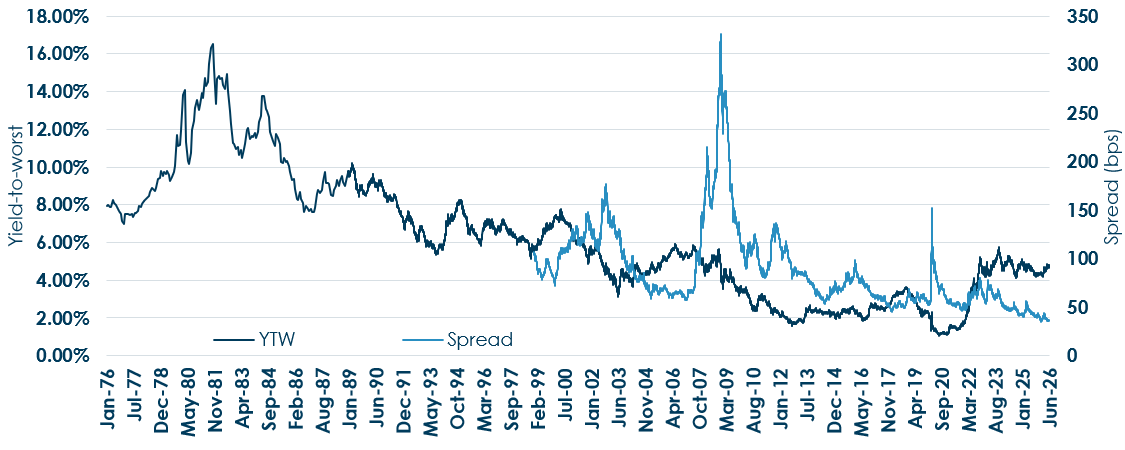
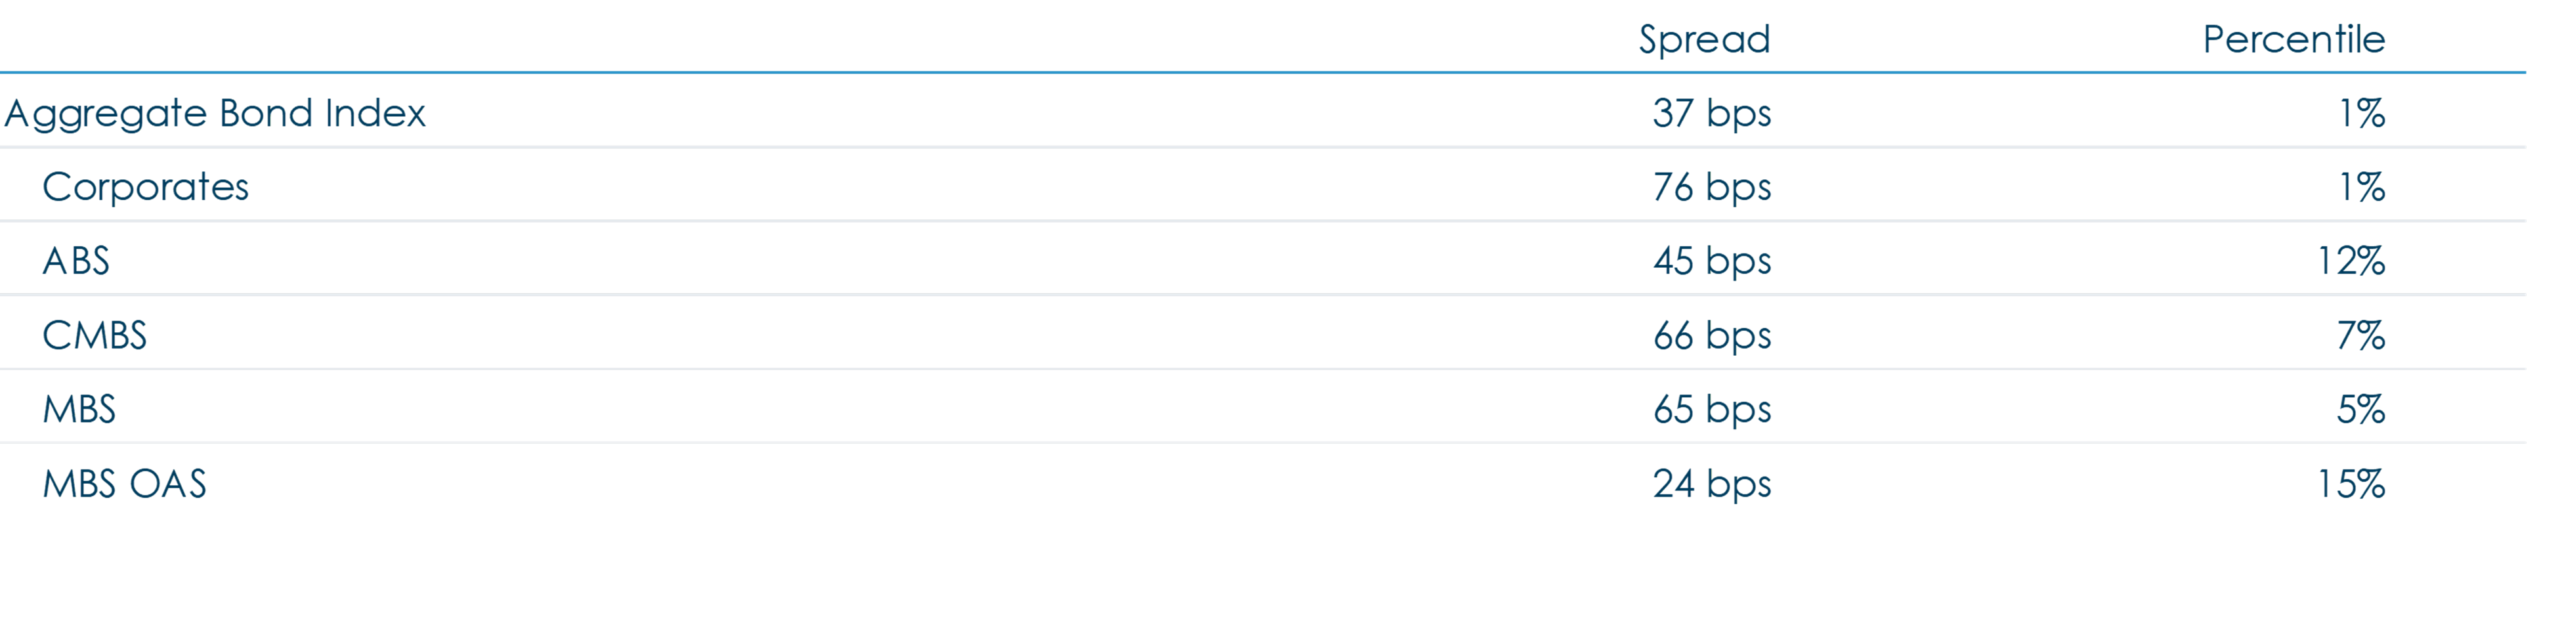
Similarly, spreads in investment grade bonds are also very low, as shown in the data below for the investment grade Bloomberg U.S. Aggregate Bond Index:
Bloomberg U.S. Aggregate Bond Index
Source: Bloomberg. As of June 30, 2026. YTW is Yield-to-Worst. Spread reflects the quoted spread of a bond that is relative to the security off which it is priced, typically an on-the-run treasury. For illustrative purposes only.
The market is priced as if nothing could go wrong. We have concerns but even if we didn’t, at historically low spreads are we getting paid to find out that things are not going well? We do not think so. Due to such low spreads, when evaluating individual investment opportunities, more often than not we find the compensation for credit risk is inadequate. Further, we believe low spreads increase the likelihood and magnitude of a potential short-term drawdown related to an increase in spreads.
When faced with an unattractive price, we look elsewhere until we find an attractive price. To help understand our direction of travel, conceptually we can think about our investment process as follows: we typically will look first for attractive Credit and High Quality investments. If we cannot find attractive investments, we typically hold cash. Thus, cash is the residual of our investment process. We have said in the past that our cash balance is a reflection of the opportunity set. A lower cash balance reflects what we believe is an attractive investing environment and a higher cash balance reflects an unattractive environment. There can be at times, however, a stop on the way to cash: Treasuries.
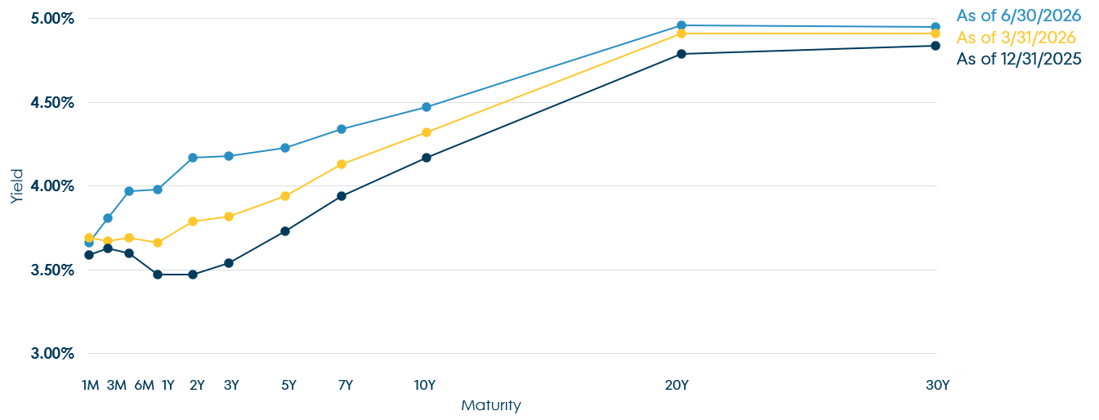
Treasury yields increased during the quarter and year-to-date, as shown below:
U.S. Treasury Yield Curve
Maturity
| Change in yield (bps) | 1Y | 2Y | 3Y | 5Y | 7Y | 10Y | 20Y | 30Y |
|---|---|---|---|---|---|---|---|---|
| Q2 2026 | 32 | 38 | 37 | 28 | 21 | 15 | 5 | 4 |
| YTD 2026 | 51 | 70 | 64 | 50 | 40 | 30 | 17 | 11 |
Source: Bloomberg; As of June 30, 2026. For illustrative purposes only.
U.S. Treasury Yield
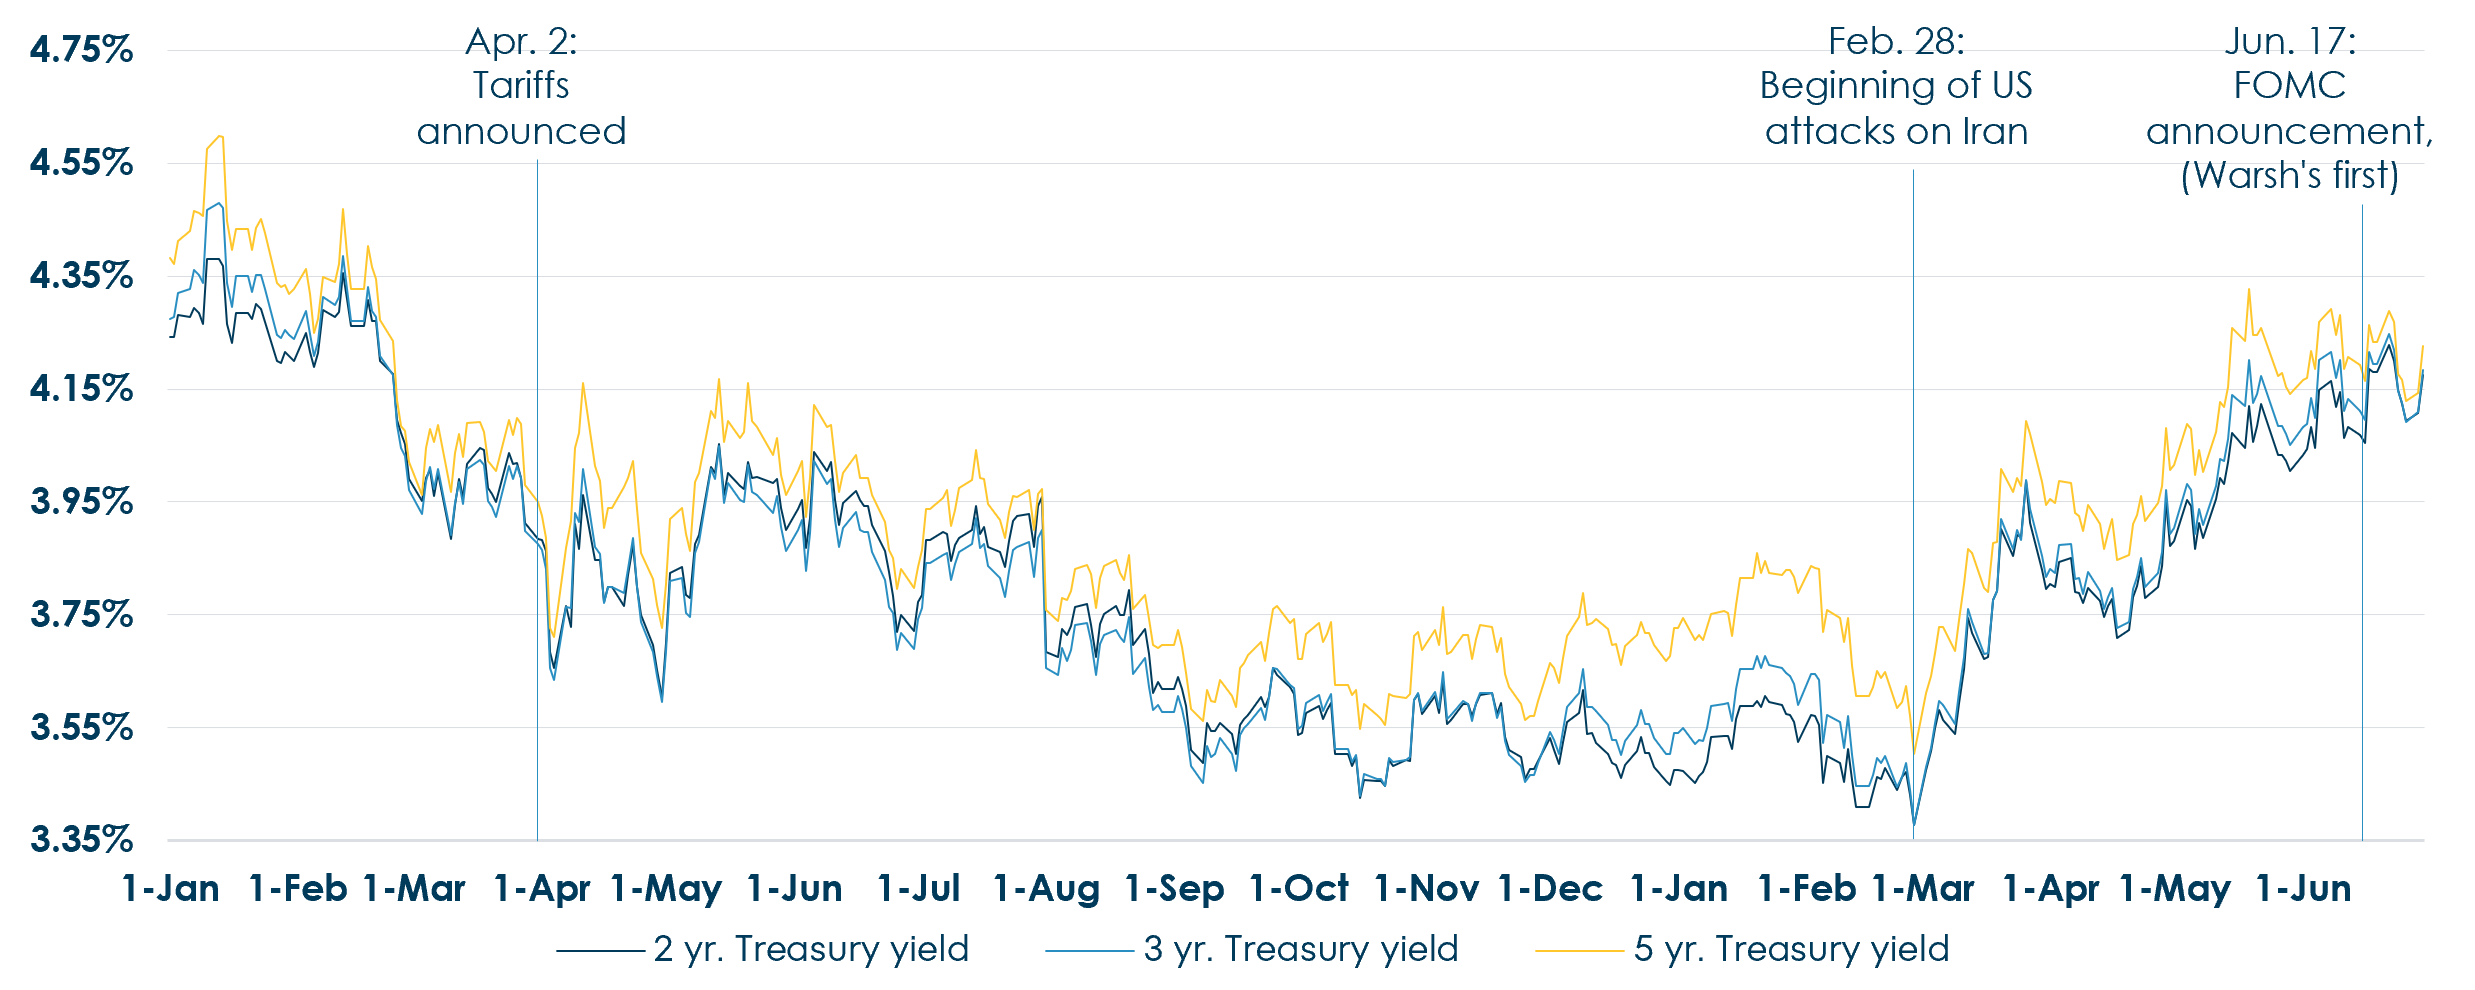
Source: Bloomberg. As of June 30, 2026. For illustrative purposes only.
U.S. Treasury Yield and Fund Duration
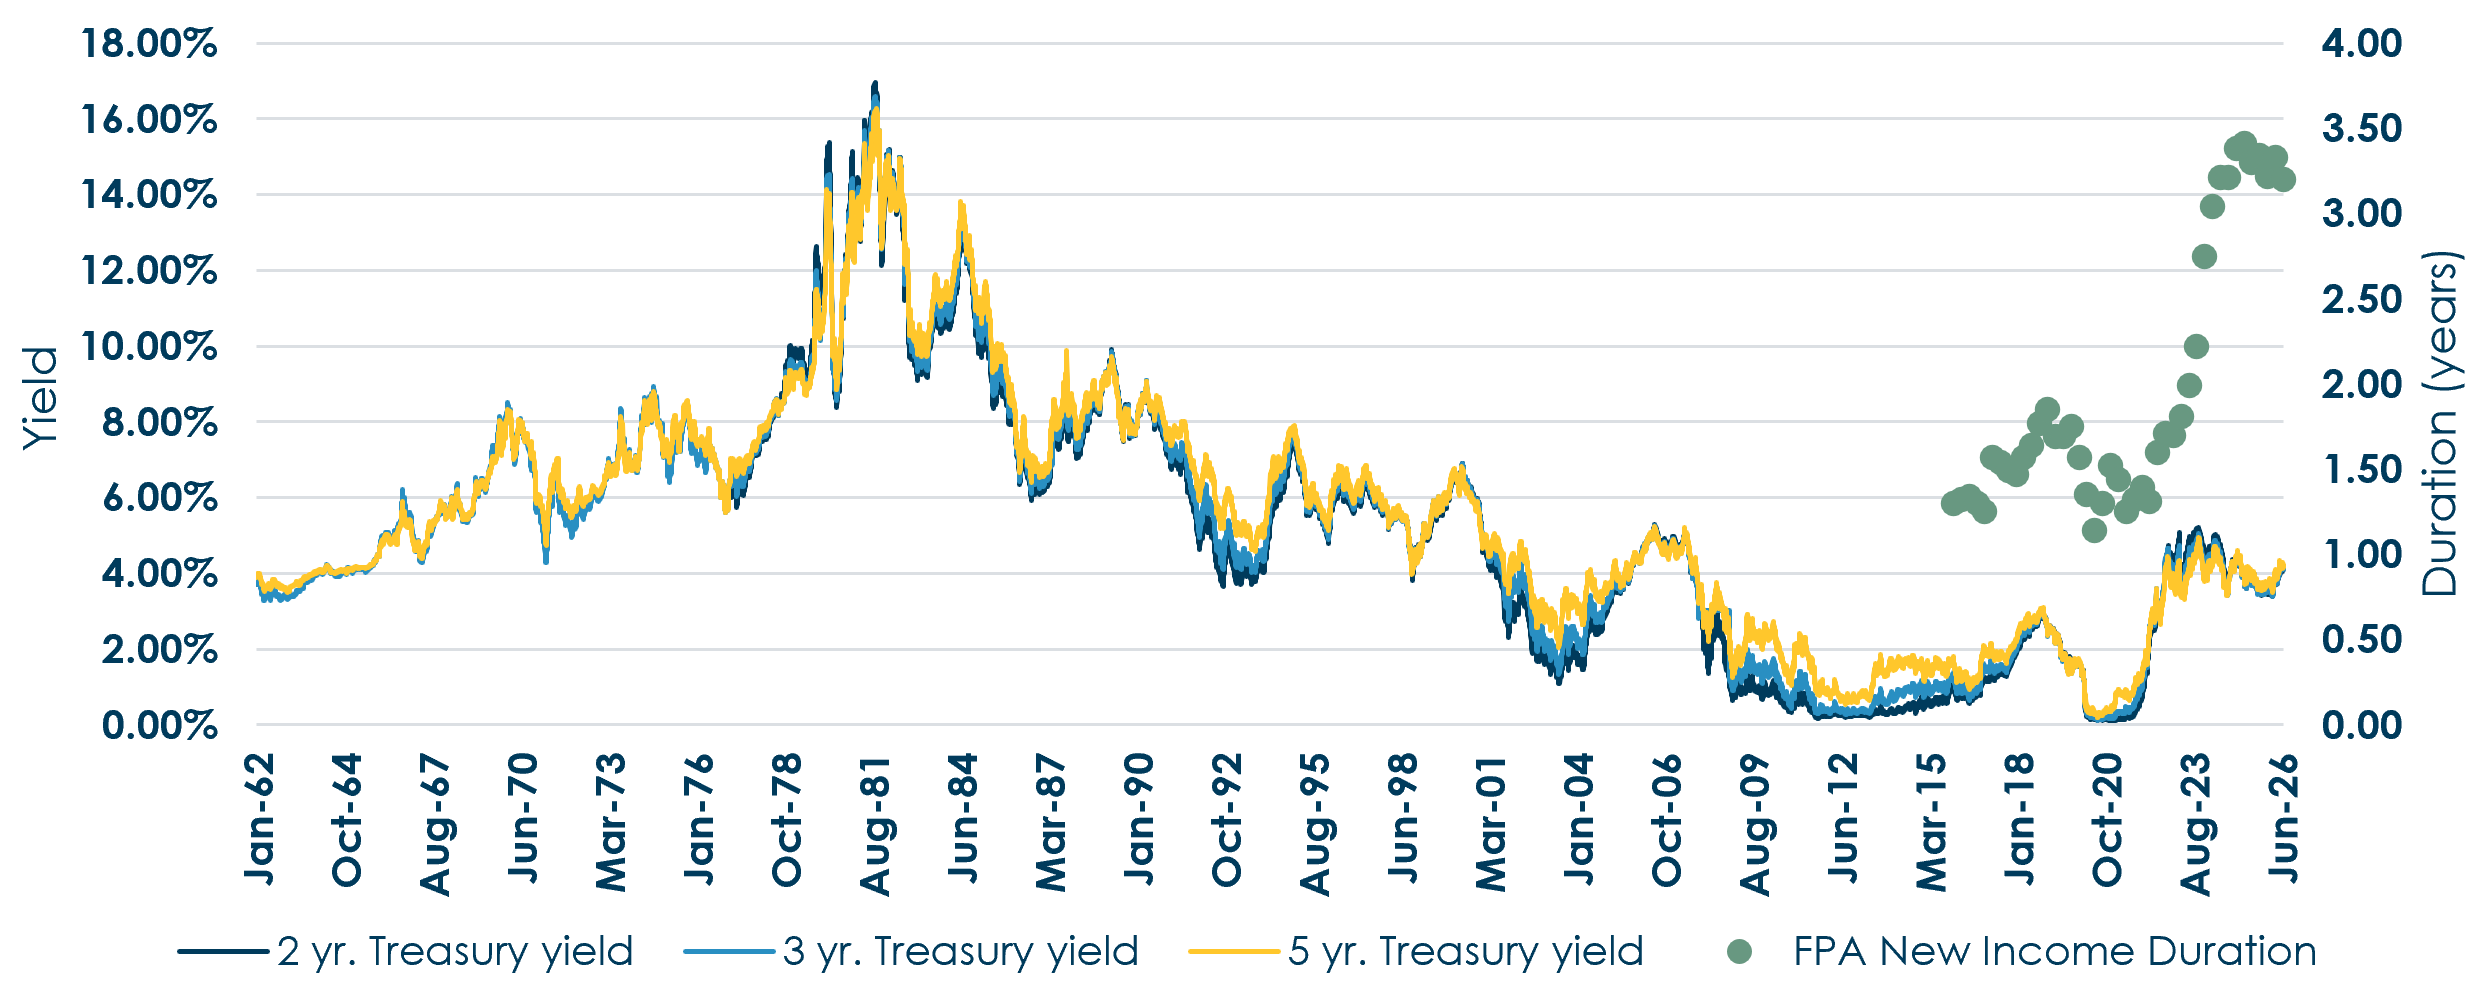
Source: Bloomberg. Data from 1/5/1962 – 6/30/2026. FPA New Income Fund duration data points are shown are shown with quarterly frequency. FPA New Income Fund duration is shown for the trailing ten years as this is believed to provide a standard sufficient history. The Fund has increased its duration in recent years as Treasury yields increased.For illustrative purposes only.
Just because the market for credit risk is expensive does not mean we are hiding in a bunker with a pile of cash. There can still be attractive rewards available for taking on risk, specifically duration risk. With risk-free rates at 10-15 year highs, buying duration via Treasuries can be an attractive investment. Over the long-term, Treasuries can provide an attractive absolute “risk-free” return. Over the short-term, Treasuries create the possibility of high single digit returns in a declining interest rate environment while simultaneously providing some ability to mitigate drawdowns that might occur in a rising interest rate environment. Our 100 bps duration test guides us in identifying an attractive risk versus reward with respect to duration.
We illustrate the potential duration-related returns here:
Hypothetical 12-Month U.S. Treasury Returns
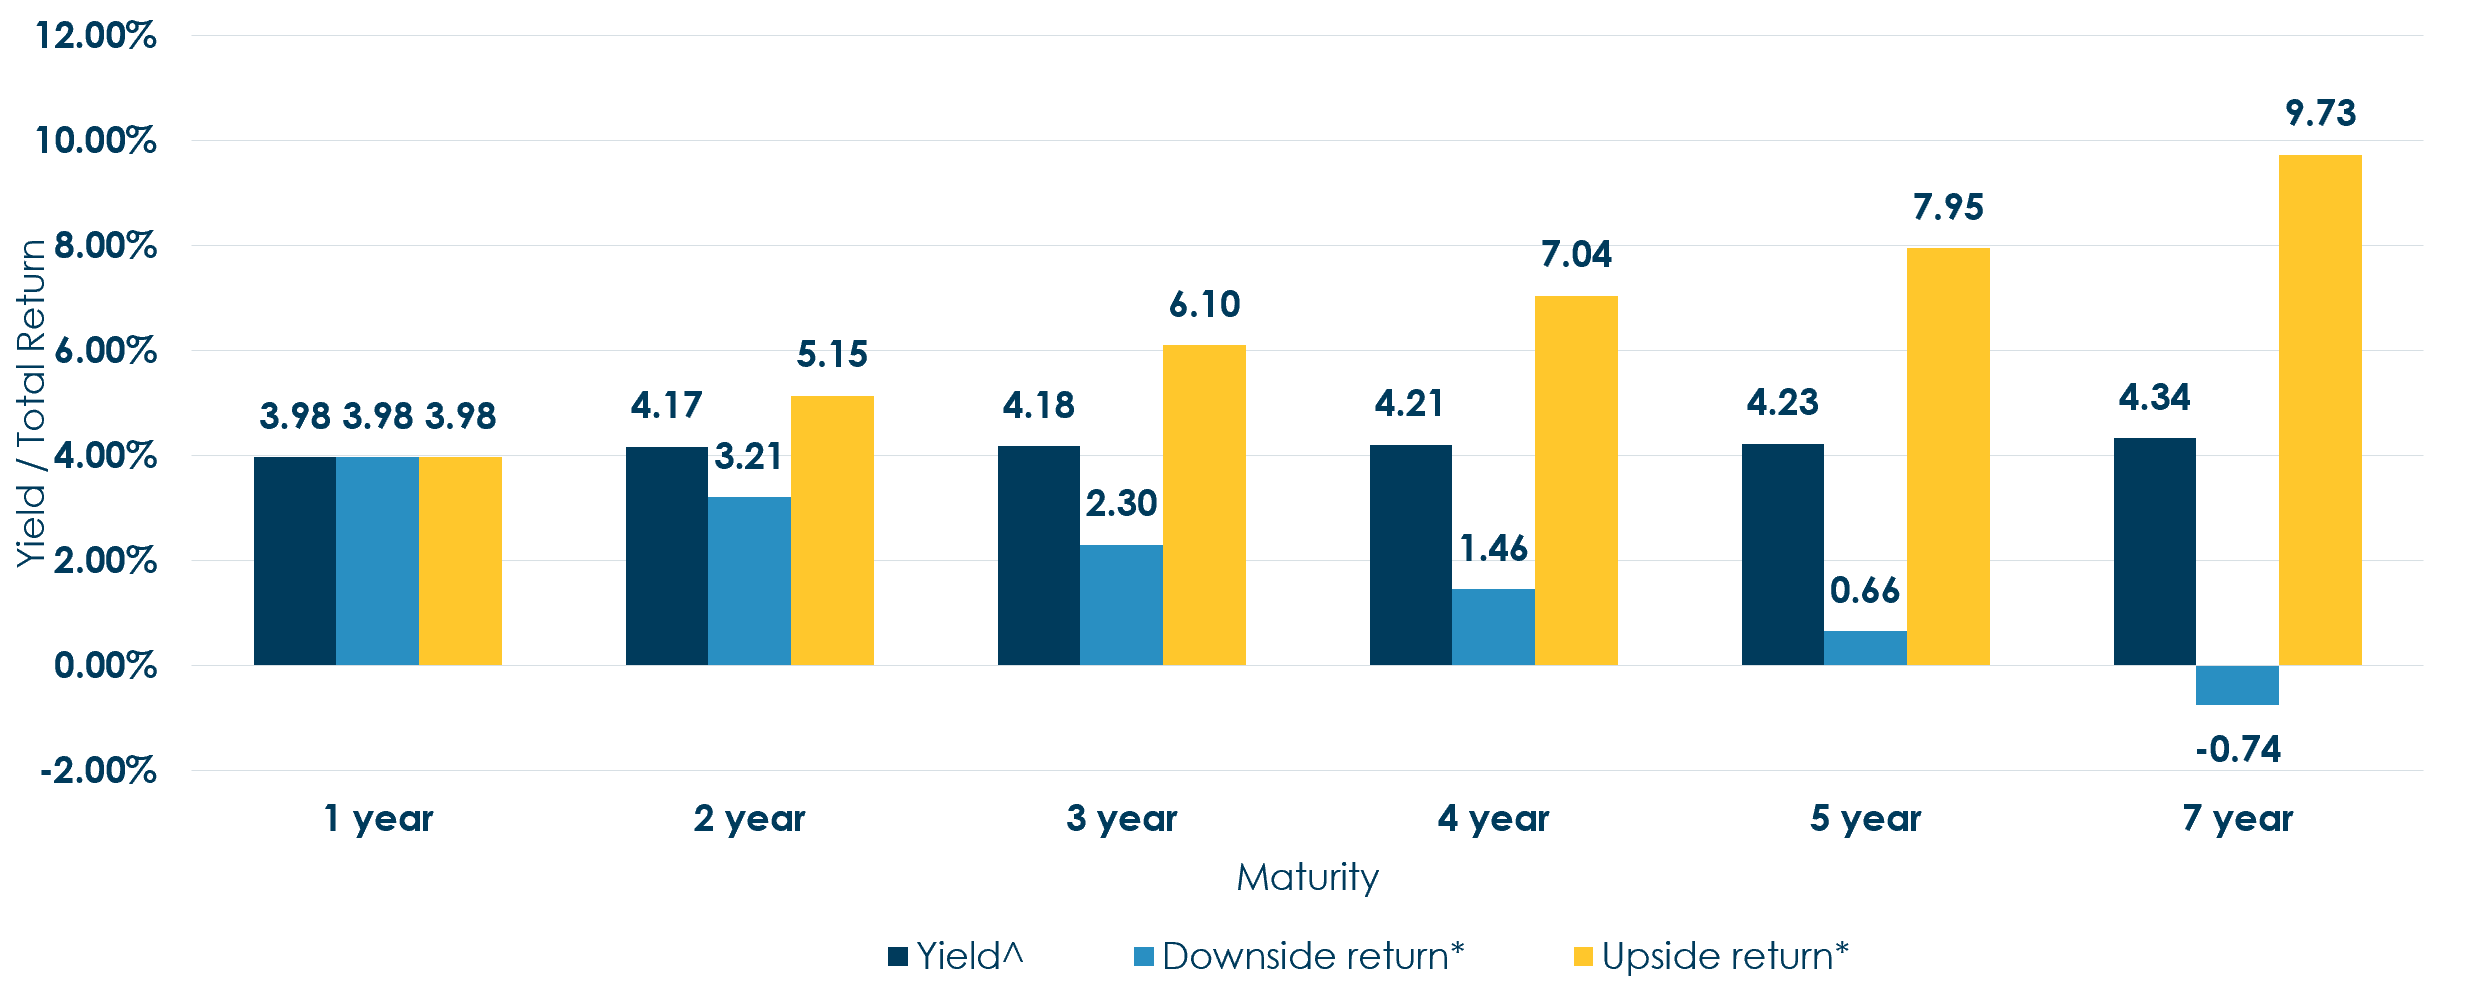
As of June 30, 2026. Source: Bloomberg. This chart illustrates factors that the investment team considers when assessing interest rate risk and shows how interest rate increase could affect investments. ^Yield to Maturity (YTM) is the total return anticipated on a bond if the bond is held until it matures. *Downside return estimates the 12-month total return assuming yields increase by 100 bps over 12 months. Upside return estimates the 12-month total return assuming yields decline by 100 bps over 12 months. Return estimates assume gradual change in yield over 12 months. The hypothetical stress test data provided herein is for illustrative and informational purposes only and is intended to demonstrate the mathematical impact of a hypothetical change in Treasury yields on Treasury returns. This data is not, and is not intended to be representative of, the Fund’s returns. No representation is being made that any account, product or strategy will or is likely to achieve profits, losses, or results similar to those shown. FPA applies a 100-basis point duration test to seek to identify the longest-duration bonds that may produce at least a breakeven return over a 12-month period, assuming a bond’s yield will increase by 100 basis points during that period. The dark blue bars represent actual Treasury yields at various maturities as of June 30, 2026. The light blue bars represent the potential short-term downside return for these bonds in a rising interest rate environment. The yellow bars show the short-term upside potential if rates decrease by 100 basis points over 12 months. Past performance is no guarantee, nor is it indicative, of future results. Please refer to the back of the commentary for important disclosures.
Our 100 bps duration test identifies the longest duration bond that we expect will produce at least a breakeven return over twelve months if rates increase by 100 bps. The dark blue bars above show Treasury yields of various maturities at June 30, 2026. The light blue bars show the potential short-term return for these bonds in a rising interest rate environment, which we refer to as the downside return. For example, the 5-year Treasury purchased at a 4.23% yield was expected to return 0.66% over twelve months if its yield increased by 100 bps from 4.23% to 5.23% during that time.
Alternatively, the yellow bars on the chart above indicate the short-term upside return potential over twelve months if rates decrease by 100 bps. In the example above, the 5-year Treasury offered a potential 12-month total return of 7.95%. We find the combination of a 4.23% base case return, a potential 0.66% downside return and a potential 7.95% upside return compelling. Importantly, we are downside focused first. As such, we would not find this return profile attractive were it not for the ability to expect at least a breakeven return in a rising interest rate environment – this is the premise behind our 100 bps duration test.
The duration analysis above explains the Fund’s Treasury exposure. Like cash, the Treasury exposure is a reflection of the dearth of more attractive opportunities. Unlike cash, Treasuries avoid some of the opportunity cost of cash if interest rates decline.
Putting everything together, as we evaluate individual investment opportunities, low spreads cause us to choose lower credit risk investments instead of higher credit risk investments – even within the investment grade universe – and high risk-free rates cause us to choose longer duration investments instead of shorter duration investments. To be clear, we are not categorically waving off everything with a high yield rating or that sits within the lower quality tiers of the investment grade universe. We make our decisions at the individual investment level. Repeating those decisions has led us to low Credit exposure and a relatively longer duration at the portfolio level. Some may not find this positioning exciting. We do. We are excited about not owning a portfolio laden with overpriced credit risk. We are excited about the ability to capture a lot of the return of the bond market in a falling interest rate environment but with some ability to mitigate drawdowns in a rising interest rate environment.
There is much to celebrate this July, America’s 250th birthday. Please forgive us for focusing on the negatives. As bond investors, we are typically not paid to do otherwise. We recognize that other fixed income managers’ greater credit exposure may allow them to make more money than we do in the short-term (and we emphasize “we” because we are also investors in the Fund). However, we also recognize that spreads are very low and we would not want to jeopardize your capital and ours by taking on uncompensated risk. Though we are ready to change our positioning if and when the market gets cheaper, we further recognize that the market for credit risk can remain expensive for a long time. We believe that patience in waiting for more attractive opportunities will be rewarded in the long-term. In a nod to the World Cup, we feel like we are in the 90th minute of the match but there may be stoppage time and perhaps extra time6. If this current episode is anything like past episodes of market exuberance, then just like a World Cup match, it will end at some point although it’s not clear exactly when. Until then, we will be like those teams that play defense the entire game –boring to watch but exciting once they find an opportunity to strike.
6In search of wisdom on how to navigate and explain a market like today’s, we looked to the writings of esteemed value investors in the years before the popping of the internet bubble in the early 2000’s. Fortunately, an esteemed value investor – Steven Romick – works down the hall from us. This tortured soccer analogy is a riff on a more elegant baseball analogy that Mr. Romick used in July 1998 to describe the market as being in the ninth inning of a potential 15-inning baseball game.
Thank you for your confidence and continued support.
Abhijeet Patwardhan
Portfolio Manager
July 2026
Important Information
This Commentary is for informational and discussion purposes only and does not constitute, and should not be construed as, an offer or solicitation for the purchase or sale of any securities, products or services discussed, and neither does it provide investment advice. Any such offer or solicitation shall only be made pursuant to the Fund’s Prospectus, which supersedes the information contained herein in its entirety.
The views expressed herein and any forward-looking statements are as of the date of the publication and are those of the portfolio management team. Future events or results may vary significantly from those expressed and are subject to change at any time in response to changing circumstances and industry developments. This information and data has been prepared from sources believed reliable, but the accuracy and completeness of the information cannot be guaranteed and is not a complete summary or statement of all available data. You should not construe the contents of this document as legal, tax, accounting, investment or other advice or recommendations.
Portfolio composition will change due to ongoing management of the Fund. References to individual securities or sectors are for informational purposes only and should not be construed as recommendations by the Fund, the portfolio manager, the Adviser, or the distributor. It should not be assumed that future investments will be profitable or will equal the performance of the security or sector examples discussed. The portfolio holdings as of the most recent quarter-end may be obtained at fpa.com.
The statements made herein may be forward-looking and/or based on current expectations, projections, and/or information currently available. Actual results may differ from those anticipated. The portfolio manager and/or FPA cannot assure future results and disclaims any obligation to update or alter any statistical data and/or references thereto, as well as any forward-looking statements, whether as a result of new information, future events, or otherwise. Such statements may or may not be accurate over the long-term.
Investments carry risks and investors may lose principal value. Capital markets are volatile and can decline significantly in response to adverse issuer, political, regulatory, market, or economic developments. The Fund may purchase foreign securities, including depository receipts, which are subject to interest rate, currency exchange rate, economic and political risks; these risks may be elevated when investing in emerging markets. Foreign investments, especially those of companies in emerging markets, can be riskier, less liquid, harder to value, and more volatile than investments in the United States. The securities of smaller, less well-known companies can be more volatile than those of larger companies.
The return of principal in a bond fund is not guaranteed. Bond funds have the same issuer, interest rate, inflation and credit risks that are associated with underlying bonds owned by the Fund. Lower rated bonds, convertible securities and other types of debt obligations involve greater risks than higher rated bonds.
Interest rate risk is the risk that when interest rates go up, the value of fixed income instruments, such as bonds, typically go down and investors may lose principal value. Credit risk is the risk of loss of principal due to the issuer’s failure to repay a loan. Generally, the lower the quality rating of a fixed income instrument, the greater the risk that the issuer will fail to pay interest fully and return principal in a timely manner. If an issuer defaults, the fixed income instrument may lose some or all of its value.
Mortgage securities and collateralized mortgage obligations (CMOs) are subject to prepayment risk and the risk of default on the underlying mortgages or other assets; such derivatives may increase volatility. Convertible securities are generally not investment grade and are subject to greater credit risk than higher-rated investments. High yield securities can be volatile and subject to much higher instances of default.
Collateralized debt obligations (“CDOs”), which include collateralized loan obligations (“CLOs”), collateralized bond obligations (“CBOs”), and other similarly structured securities, carry additional risks in addition to interest rate risk and default risk. This includes, but is not limited to: (i) distributions from the underlying collateral may not be adequate to make interest or other payments; (ii) the quality of the collateral may decline in value or default; and (iii) the complex structure of the security may not be fully understood at the time of investment and may produce disputes with the issuer or unexpected investment results. Investments in CDOs are also more difficult to value than other investments.
Value style investing presents the risk that the holdings or securities may never reach their full market value because the market fails to recognize what the portfolio management team considers the true business value or because the portfolio management team has misjudged those values. In addition, value style investing may fall out of favor and underperform growth or other styles of investing during given periods.
The ratings agencies that provide ratings are Standard and Poor’s (“S&P”), Fitch, Moody’s, Kroll, DBRS, and any other nationally recognized statistical rating organization (“NRSRO”). Credit ratings range from AAA (highest) to D (lowest). Bonds rated BBB or above are considered investment grade. Credit ratings of BB and below are lower-rated securities (junk bonds). High-yielding, non-investment grade bonds (junk bonds) involve higher risks than investment grade bonds. Bonds with credit ratings of CCC/Caa or below have high default risk. Please refer to the Fund’s Prospectus for a complete overview of the primary risks associated with the Fund.
The Fund is not authorized for distribution unless preceded or accompanied by a current prospectus. The prospectus can be accessed at: https://fpa.com/resources.
Hypothetical Stress-Tested Results
The hypothetical and estimated data provided herein is for illustrative and informational purposes only. No representation is being made that Fund or the securities used for the simulation will or is likely to achieve profits, losses, or results similar to those shown. Hypothetical and estimated results do not reflect trading in actual accounts, and do not reflect the impact that economic, market or other factors may have on the management of the account.
The hypothetical and estimated results as set forth in this commentary do not represent actual results; actual results may significantly differ from the theoretical data being presented. Hypothetical/estimated results have certain inherent limitations. Hypothetical models theoretically may be changed from time to time to obtain more favorable results. There may be sharp differences between simulated or estimated results and the actual results subsequently achieved by any particular security, account, product or strategy. In addition, simulated/estimated results cannot account for the impact of certain market risks such as a lack of liquidity or default risk. There are numerous other factors related to the markets in general or the implementation of any specific strategy which cannot be fully accounted for in the preparation of simulated or estimated results, all of which can adversely affect actual results.
A client’s individual portfolio results may vary from any hypothetical or estimated results because of the timing of trades, deposits and withdrawals, the impact of management fees and taxes, market fluctuations, trading costs, cash flows, custodian fees, among other factors. Hypothetical results are not meant to be construed as a prediction of the future return of the Fund. Past performance is no guarantee, nor is it indicative, of future results.
Index Definitions
Comparison to any index is for illustrative purposes only and should not be relied upon as a fully accurate measure of comparison. The Fund will be less diversified than the indices noted herein and may hold non-index securities or securities that are not comparable to those contained in an index. Indices will hold positions that are not within the Fund’s investment strategy. Indices are unmanaged, do not reflect any commissions, fees or expenses which would be incurred by an investor purchasing the underlying securities. The Fund does not include outperformance of any index or benchmark in its investment objectives. Investors cannot invest directly in an index
Bloomberg U.S. Aggregate Bond Index provides a measure of the performance of the U.S. investment grade bonds market, which includes investment grade U.S. Government bonds, investment grade corporate bonds, mortgage pass-through securities and asset-backed securities that are publicly offered for sale in the United States. The securities in the Index must have at least 1 year remaining in maturity. In addition, the securities must be denominated in U.S. dollars and must be fixed rate, nonconvertible, and taxable.
Bloomberg U.S. Aggregate 1-3 Year Bond Index provides a measure of the performance of the U.S. investment grade bonds market, which includes investment grade U.S. Government bonds, investment grade corporate bonds, mortgage pass-through securities and asset-backed securities that are publicly offered for sale in the United States. The securities in the Index must have a remaining maturity of 1 to 3 years. In addition, the securities must be denominated in U.S. dollars and must be fixed rate, nonconvertible, and taxable.
Bloomberg U.S. Corporate High Yield Bond Index measures the market of USD-denominated, non-investment grade, fixed-rate, taxable corporate bonds.
Bloomberg U.S. Investment Grade Corporate Index measures the investment grade, fixed-rate, taxable corporate bond market. It includes USD denominated securities publicly issued by US and non-US industrial, utility, and financial issuers.
Consumer Price Index (CPI) is an unmanaged index representing the rate of the inflation of the U.S. consumer prices as determined by the U.S. Department of Labor Statistics. This index reflects non-seasonally adjusted returns. There can be no guarantee that the CPI or other indexes will reflect the exact level of inflation at any given time.
CPI +100 Basis Points is created by adding 1% to the annual percentage change in the Consumer Price Index (“CPI”).
Merrill Lynch Option Volatility Estimate (MOVE) Index reflects the level of volatility in U.S. Treasury futures. The index is considered a proxy for term premiums of U.S. Treasury bonds (i.e., the yield spread between long-term and short-term bonds).
Morningstar Short-Term Bond portfolios invest primarily in corporate and other investment-grade U.S. fixed-income issues and typically have durations of 1.0 to 3.5 years. These portfolios are attractive to fairly conservative investors, because they are less sensitive to interest rates than portfolios with longer durations. Morningstar calculates monthly breakpoints using the effective duration of the Morningstar Core Bond Index in determining duration assignment. Short-term is defined as 25% to 75% of the three-year average effective duration of the MCBI. As of June 30, 2026, there were 549 funds in the category.
Glossary of Terms
ABS (Asset Backed Securities) are financial securities backed by a loan, lease or receivables against assets other than real estate and mortgage-backed securities.
Average Life (years) is the average length of time that each dollar of unpaid principal on a loan, a mortgage or an amortizing bond remains outstanding.
Basis Point (bps) is equal to one hundredth of one percent, or 0.01%. 100 basis points = 1%.
CLO (Collateralized Loan Obligation) is a single security backed by a pool of debt.
CMBS (Commercial Mortgage Backed Security) is a mortgage-backed security backed by commercial mortgages rather than residential mortgages.
Credit is defined as investments rated BBB or lower, including non-rated investments.
Effective Duration measures the sensitivity of the price to changes in interest rates, incorporating the impact of changes in interest rates on call options and expected cashflows. Calculations for the Fund exclude equity holdings.
A fixed rate bond is a bond that pays the same level of interest over its entire term.
Floating-rate security, also known as a “floater”, is an investment with interest payments that float or adjust periodically based upon a predetermined benchmark.
High Quality is defined as investments rated A or higher, Treasuries, and cash and equivalents.
On-the-run Treasuries are the most recently issued U.S. Treasury bonds, notes, or bills of a specific maturity and can serve as benchmarks for pricing other financial instruments.
Risk-free rate of return is the theoretical rate of return of an investment with zero risk. The risk-free rate represents the interest an investor would expect from an absolutely risk-free investment over a specified period of time.
RMBS (Residential Mortgage Backed Securities) are mortgage-backed securities backed by residential mortgages.
Spread Duration is the sensitivity of the price of a security to changes in its credit spread. The credit spread is the difference between the yield of a security and the yield of a benchmark rate, such as a cash interest rate or government bond yield. Calculations for the Fund exclude equity holdings.
©2026 Morningstar, Inc. All Rights Reserved. The information contained herein: (1) is proprietary to Morningstar and/or its content providers; (2) may not be copied or distributed; and (3) is not warranted by Morningstar to be accurate, complete or timely. Neither Morningstar nor its content providers are responsible for any damages or losses arising from any use of this information. Past performance is no guarantee of future results.
The FPA Funds are distributed by Distribution Services, LLC. 190 Middle Street, Suite 301, Portland, ME 04101. Distribution Services, LLC and FPA are not affiliated.