
Unless otherwise noted, all figures and opinions are as of 3/16/2020 and are preliminary and subject to change.
Executive Summary
- Due to elevated valuations in many of the equities we own and a lack of distress or adequate yields in the credit markets, the FPA Crescent Fund (“the Fund”) began 2020 with a net equity exposure of ~57%
- Given better risk/rewards in many securities, we have recently increased it by ~1000 bps to ~67%
- We have removed some market hedges, selectively added to existing names and purchased new companies with strong balance sheets
- The S&P 500 is now back at December 2018 levels1
- Unless one wants to make a call on energy prices, travel or financials, we do not think there is much at “throw away prices” – yet
- We have yet to materially increase the Fund’s credit exposure
- High-yield ex-energy is not cheap yet
- The Fund does not have meaningful exposure to travel- or energy-related stocks (as of year-end or recently)
- We do not believe any of the Fund’s long equity holdings have balance sheet issues
- We believe the Fund still has ample liquidity to take advantage of potential future opportunities2
Details
- Equities are not cheap – yet
- Due to elevated valuations in many of the equities we own and a lack of distress or adequate yields in the credit markets, we began 2020 with a net risk exposure of just 63.7%
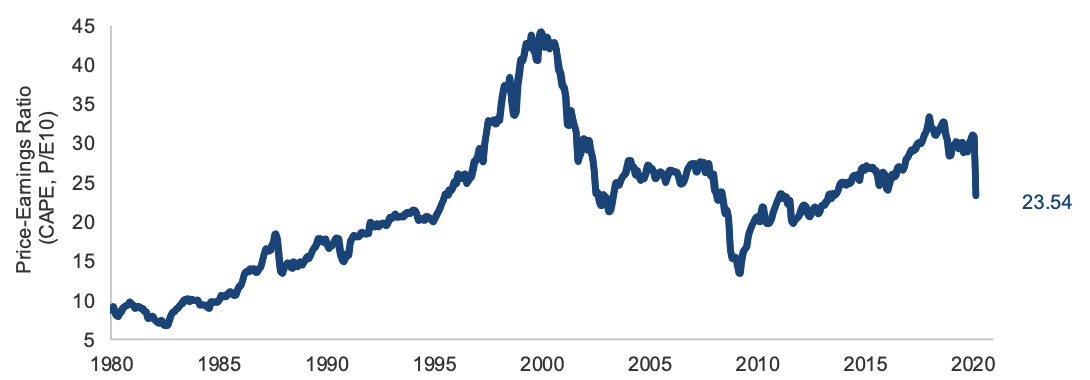
- This was nearly 10 percentage points less risk exposure than the end of 2018 and one of our lowest exposures in recent years o The S&P 500 was at a Shiller P/E (10-year cyclically adjusted) of ~31x as of the end of February, higher than the 27x level at the previous market peak in October 2007
- The S&P 500 is now at a ~23x Shiller P/E, as of March 16, 2020
- The S&P would need to drop another ~10% (~2150 on S&P 500) to get to a 20x Shiller P/E
- Recall the market was at a 13x Shiller P/E in March 2009 o The market has dropped ~30% but is still ~1.5% higher than the December 2018 lows3
Exhibit A: Shiller P/E4
- High-yield ex-energy is not cheap yet
- The Bloomberg Barclays US High-Yield ex-Energy index has a yield-to-worst of just 8.01%
Exhibit B: US High Yield ex Energy (YTW) vs 10-Year US Treasury Yield5
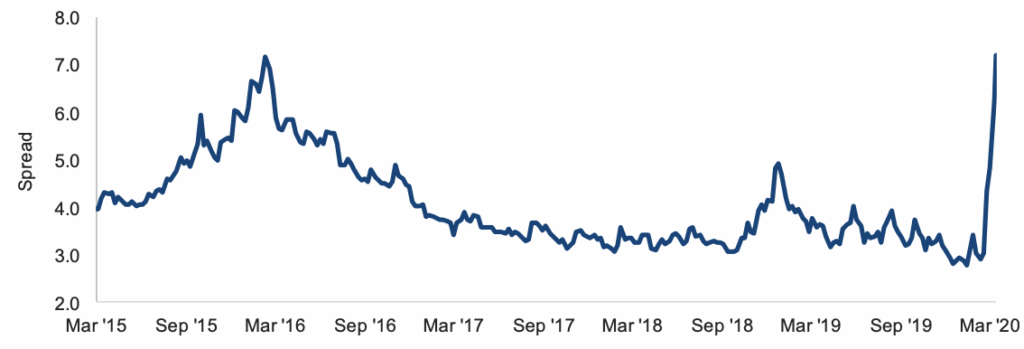
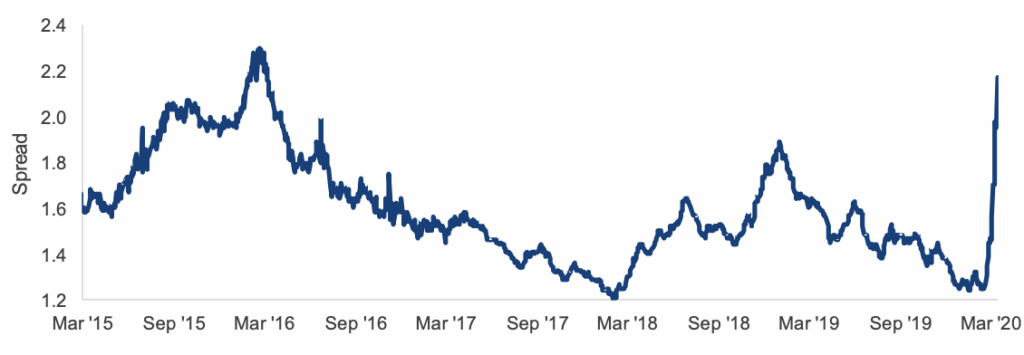
Exhibit C: US Corporate BBB-Baa vs 10-Year US Treasury Yield6
- We have increased the Fund’s net equity exposure since the end of 2019
- We believe part of the portfolio is priced at attractive risk/rewards but part is still priced at just good risk/rewards
- By no means do we think prices are at crisis or “you have to do well” in a worst-case scenario level for high-quality businesses
- This is why we have increased exposure, but have not become more fully invested
- While we hope to become fully invested, we see enough downside to continue wait for what we believe to be great prices
- When we think great prices arrive, we will ring the bell
Exhibit D: FPA Crescent Fund Preliminary Equity Exposure7
| Year-End 12/31/2019 | Market Peak 2/19/2020 | Recent Portfolio 3/13/2020 | |
|---|---|---|---|
| Common Stock, Long | 67.5% | 67.2% | 68.0% |
| Common Stock, Short | -10.3% | -10.4% | -1.1% |
| Common Stock, Net | 57.2% | 56.8% | 66.9% |
Thank you for your continued support.
You should consider the Fund’s investment objectives, risks, and charges and expenses carefully before you invest. The Prospectus details the Fund’s objective and policies and other matters of interest to a prospective investor. Please read the Prospectus carefully before investing. The Prospectus may be obtained by visiting the website at www.fpa.com, by calling toll-free, 1-800-982-4372, or by contacting the Fund in writing.
| Trailing Performance (%) | |||||||||||
|---|---|---|---|---|---|---|---|---|---|---|---|
| As of Date: 12/31/2019 | Inception* | 20 Years | 15 Years | 10 Years | 5 Years | 3 Years | 1 Year | YTD | QTD | 3/25/00-10/9/07 | 10/10/07-12/31/2019 |
| FPA Crescent Fund | 10.00 | 9.42 | 7.54 | 8.17 | 5.78 | 7.04 | 20.02 | 20.02 | 5.69 | 14.70 | 6.68 |
| S&P 500 | 9.81 | 6.06 | 9.00 | 13.56 | 11.70 | 15.27 | 31.49 | 31.49 | 9.07 | 2.00 | 8.39 |
| MSCI ACWi** | – | – | – | – | 8.41 | 12.44 | 26.60 | 26.60 | 8.95 | – | 4.60 |
| 60% S&P 500/40% BBgBarc US Agg | 8.25 | 5.94 | 7.30 | 9.77 | 8.37 | 10.87 | 22.18 | 22.18 | 5.46 | 3.97 | 7.01 |
| CPO | 2.22 | 2.16 | 2.01 | 1.75 | 1.82 | 2.11 | 2.29 | 2.29 | 0.84 | 2.75 | 1.77 |
Periods greater than one year are annualized. FPA Crescent Fund (“Fund”) performance is shown net of all fees and expenses. Fund performance is calculated on a total return basis which includes reinvestment of all distributions. Fund performance does not reflect the deduction of taxes that a shareholder would pay on Fund distributions or the redemption of Fund shares, which would lower these returns. Comparison to any index is for illustrative purposes only. The Fund does not include outperformance of any index or benchmark in its investment objectives. An investor cannot invest directly in an index.
* The Fund commenced operations on June 2, 1993. The performance shown for periods prior to March 1, 1996 reflects the historical performance of a predecessor fund. FPA assumed control of the predecessor fund on March 1, 1996. The Fund’s objectives, policies, guidelines, and restrictions are, in all material respects, equivalent to those of the predecessor fund.
** The MSCI ACWI was not considered a relevant illustrative index prior to 2011 because the Fund was not classified as a global mandate until this point in time. Market Cycle Performance for MSCI ACWI is being shown for illustrative purposes only to illustrate how global equities have performed in the current market cycle.
Market Cycle Performance reflects the two most recent market cycles (peak to peak) defined as a period that contains a decline of at least 20% from the previous market peak over at least a two-month period and a rebound to establish a new peak above the prior market peak. The current cycle is ongoing and thus presented through the most recent quarter-end. Once the cycle closes, the results presented may differ materially.
Past performance is no guarantee of future results and current performance may be higher or lower than the performance shown. This data represents past performance and investors should understand that investment returns and principal values fluctuate, so that when you redeem your investment it may be worth more or less than its original cost. Current month-end performance data, which may be lower or higher than the performance data quoted, may be obtained at www.fpa.com or by calling toll-free, 1-800-982-4372. The Fund’s expense ratio as of its most recent prospectus is 1.18%. A redemption fee of 2% will be imposed on redemptions within 90 days.
1 VThe S&P 500 was at 2,386.13 as of the close on March 16, 2020 and it was 2,506.85 as of the close on December 31, 2018. The S&P 500’s low in December 2018 occurred on December 24, 2018 with a close of 2351.10.
2 The Fund’s cash and cash equivalent exposure at 12/31/2019 was 36.3%
3 See footnote 1 for S&P 500 levels in December 2018.
4 Source: Robert Shiller, http://www.econ.yale.edu/~shiller/data.htm, as of March 16, 2020. The Shiller P/E ratio is calculated by dividing the current price of the S&P 500 by ten-year average earnings and adjusting for inflation. CAPE = cyclically adjusted priceto-earnings ratio, and is also commonly known as the Shiller P/E ratio or P/E 10 ratio
5 The last quarter-end high is used in the case of an ongoing market cycle as the peak has not yet been established. This may result in a materially different comparison upon cycle completion. Market cycle performance is not included on the FPA Paramount fact sheet because its investment universe and benchmark index changed since 2007, on the FPA International Value fact sheet because its inception date is in 2011 and on the FPA New Income fact sheet because it is a fixed-income fund and fixed-income funds have different market cycles (interest rate and credit).
6Source: Bloomberg, as of March 16, 2020. US High Yield ex Energy is represented by the Bloomberg Barclays US High Yield exEnergy Index. Yield to worst reflects the lowest possible yield on a callable bond without the issuer defaulting. It does not represent the yield an investor should expect to receive.
7 Source: FPA, as of March 16, 2020. Portfolio composition will change due to ongoing management of the Fund
Important Disclosures
This update is for informational and discussion purposes only and does not constitute, and should not be construed as, an offer or solicitation for the purchase or sale with respect to any securities, products or services discussed, and neither does it provide investment advice. Any such offer or solicitation shall only be made pursuant to the Fund’s Prospectus, which supersedes the information contained herein in its entirety. This document does not constitute an investment management agreement or offering circular.
The views expressed herein and any forward-looking statements are as of the date of the publication and are those of the portfolio management team. Future events or results may vary significantly from those expressed and are subject to change at any time in response to changing circumstances and industry developments. This information and data has been prepared from sources believed reliable, but the accuracy and completeness of the information cannot be guaranteed and is not a complete summary or statement of all available data.
Portfolio composition will change due to ongoing management of the Fund. References to individual securities or exposures are for informational purposes only and should not be construed as recommendations by the Fund, the portfolio managers, the Adviser, or the distributor. It should not be assumed that future investments will be profitable or will equal the performance of the security examples discussed. The portfolio holdings as of the most recent quarter-end may be obtained at www.fpa.com.
Investments, including investments in mutual funds, carry risks and investors may lose principal value. Capital markets are volatile and can decline significantly in response to adverse issuer, political, regulatory, market, or economic developments. The Fund may purchase foreign securities, including American Depository Receipts (ADRs) and other depository receipts, which are subject to interest rate, currency exchange rate, economic and political risks; these risks may be heightened when investing in emerging markets. Foreign investments, especially those of companies in emerging markets, can be riskier, less liquid, harder to value, and more volatile than investments in the United States. Adverse political and economic developments or changes in the value of foreign currency can make it more difficult for the Fund to value the securities. Differences in tax and accounting standards, difficulties in obtaining information about foreign companies, restrictions on receiving investment proceeds from a foreign country, confiscatory foreign tax laws, and potential difficulties in enforcing contractual obligations, can all add to the risk and volatility of foreign investments.
Small and mid-cap securities involve greater risks and may fluctuate in price more than larger company securities. Short-selling involves increased risks and transaction costs. You risk paying more for a security than you received from its sale. The return of principal in a bond investment is not guaranteed. Bonds have issuer, interest rate, inflation and credit risks. Interest rate risk is the risk that when interest rates go up, the value of fixed income securities, such as bonds, typically go down and investors may lose principal value. Credit risk is the risk of loss of principal due to the issuer’s failure to repay a loan. Generally, the lower the quality rating of a security, the greater the risk that the issuer will fail to pay interest fully and return principal in a timely manner. If an issuer defaults the security may lose some or all of its value. Lower rated bonds, callable bonds and other types of debt obligations involve greater risks. Mortgage-backed securities and asset-backed securities are subject to prepayment risk and the risk of default on the underlying mortgages or other assets. Derivatives may increase volatility.
Value securities, including those selected by the Fund’s portfolio managers, are subject to the risk that their intrinsic value may never be realized by the market because the market fails to recognize what the portfolio managers consider to be their true business value or because the portfolio managers have misjudged those values. In addition, value style investing may fall out of favor and underperform growth or other styles of investing during given periods.
The ratings agencies that provide ratings are Standard and Poor’s (“S&P”), Fitch, and Moody’s. Credit ratings range from AAA (S&P/Fitch)/Aaa (Moody’s) (highest) to D/C (lowest). Bonds rated BBB/Baa or above are considered investment grade. Credit ratings of BB/Ba and below are lower-rated securities (junk bonds). High-yielding, non-investment grade bonds (junk bonds) involve higher risks than investment grade bonds. Bonds with credit ratings of CCC/Caa or below have high default risk.
Index Definitions
Comparison to any index is for illustrative purposes only and should not be relied upon as a fully accurate measure of comparison. The Fund will be less diversified than the indices noted herein, and may hold non-index securities or securities that are not comparable to those contained in an index. Indices will hold positions that are not within the Fund’s investment strategy. Indices are unmanaged and do not reflect any commissions or fees which would be incurred by an investor purchasing the underlying securities. The Fund does not include outperformance of any index or benchmark in its investment objectives. An investor cannot invest directly in an index.
The S&P 500 Index includes a representative sample of 500 hundred companies in leading industries of the U.S. economy. The Index focuses on the large-cap segment of the market, with over 80% coverage of U.S. equities, but is also considered a proxy for the total market.
The MSCI ACWI Index, is designed to represent performance of the full opportunity set of large- and mid-cap stocks across 23 developed and 24 emerging markets. It covers more than 2,700 constituents across 11 sectors and approximately 85% of the free float-adjusted market capitalization in each market.
Bloomberg Barclays U.S. Aggregate Bond Index provides a measure of the performance of the U.S. investment grade bonds market, which includes investment grade U.S. Government bonds, investment grade corporate bonds, mortgage pass-through securities and asset-backed securities that are publicly offered for sale in the United States. The securities in the Index must have at 6 least 1 year remaining in maturity. In addition, the securities must be denominated in U.S. dollars and must be fixed rate, nonconvertible, and taxable.
Bloomberg Barclays U.S. Corporate (BBB-Baa) Bond Index measures the BBB- Baa-rated, fixed-rate, taxable corporate bond market. It includes USD-denominated securities publicly issued by US and non-US industrial, utility and financial issuers.
Bloomberg Barclays U.S. High Yield ex-Energy Index measures the high yield bond market excluding energy related bonds.
The Consumer Price Index (CPI) is an unmanaged index representing the rate of the inflation of U.S. consumer prices as determined by the U.S. Department of Labor Statistics. The CPI is presented to illustrate the Fund’s purchasing power against changes in the prices of goods as opposed to a benchmark, which is used to compare the Fund’s performance. There can be no guarantee that the CPI will reflect the exact level of inflation at any given time.
60% S&P500/ 40% Bloomberg Barclays U.S. Aggregate Bond Index is a hypothetical combination of unmanaged indices and comprises 60% S&P 500 Index and 40% Bloomberg Barclays U.S. Aggregate Bond Index.
Other Definitions
CAPE ratio (cyclically adjusted price-to-earnings) is a valuation measure that uses real earnings per share (EPS) over a 10-year period to smooth out fluctuations in corporate profits that occur over different periods of a business cycle.
Net Equity is the net invested within equities after accounting for short equity exposure
Net risk exposure refers to the percentage of the Fund exposed to Risk Assets. Risk Assets means any asset that carries a degree of risk and generally refers to assets that have a significant degree of price volatility, such as equities, commodities, high-yield bonds, real estate and currencies.
Price to Earnings is the ratio for valuing a company that measures its current share price relative to its EPS. The price-to-earnings ratio is also sometimes known as the price multiple or the earnings multiple.
The FPA Funds are distributed by UMB Distribution Services, LLC, 235 W. Galena Street, Milwaukee, WI, 53212.