
FPA Insights | March 2026
Rarely a day goes by without a new artificial intelligence (“AI”) headline. AI adoption continues to be robust, translating into revenue and (in some cases) earnings growth. For example, 2026 earnings growth for the Magnificent 7 is forecasted to be 26%, well ahead of the 14% growth for the rest of the S&P 500.1
Given this backdrop, some may be surprised that the Mag 7 declined 11% in Q1, far more than the 1% loss for the S&P 493. Meanwhile, small value stocks were up 5%.2
What explains this disconnect? One possible answer is valuations. According to Vanguard’s Capital Markets Model, U.S. small caps (and to a lesser degree “value” stocks) were squarely undervalued compared to broad U.S. equities to start the year. Even after their strong relative returns in Q1, US small caps are still undervalued (21st percentile as of 3/31 vs. 12th percentile as of 12/31).3
A Closer Look at Equity Valuations: Smaller Names Look Undervalued – As of March 31, 2026
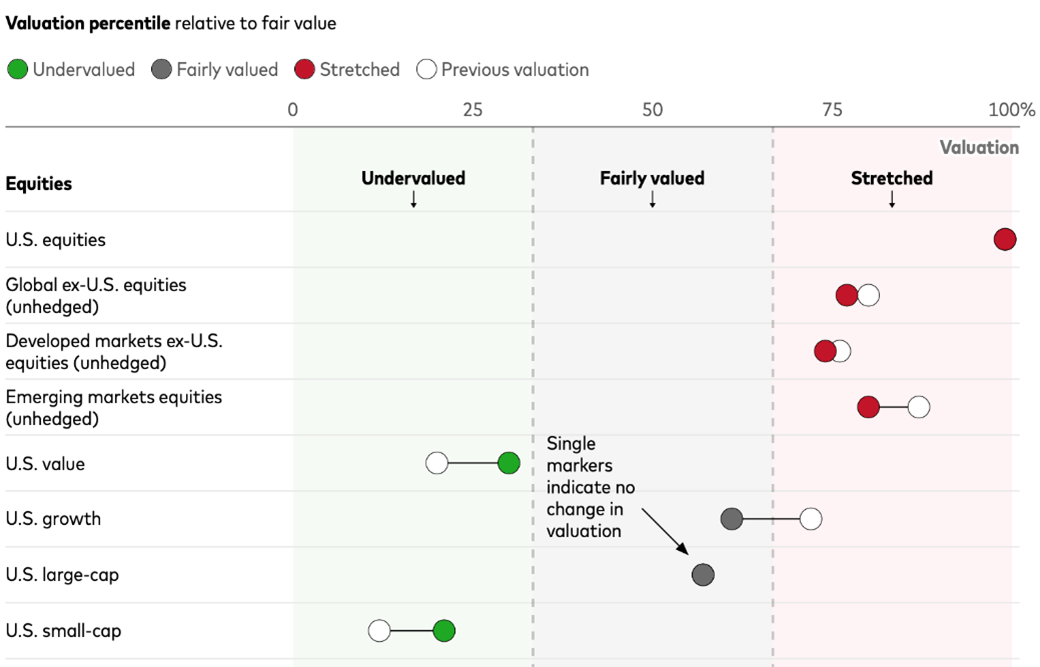
Source: https://corporate.vanguard.com/. Setting realistic expectations: Where to find value in the U.S. markets. Published on April 22, 2026.4
Our FPA Queens Road Small Cap Value Fund (QRSIX) provides exposure to smaller domestic companies, while the go-anywhere FPA Crescent Fund (FPACX) has been steadily increasing its exposure to both domestic and international small- and mid-cap companies over the past two years.
Small caps remain overlooked amid constant AI headlines. If client portfolios have drifted toward mega-cap concentration, valuations suggest now may be a reasonable time to revisit the smaller end of the market despite their strong relative performance in Q1.
Feel free to reply directly to discuss how our strategies might be a good fit.
Endnotes:
1 Source: JP Morgan: Guide to the Markets – March 31, 2026. https://cdn.jpmorganfunds.com/content/dam/jpm-am-aem/global/en/insights/market-insights/guide-to-the-markets/mi-guide-to-the-markets-us.pdf
2 Source: Morningstar Direct
3 Source: Morningstar Direct
4 The valuation percentiles are as of December 31, 2025, and March 31, 2026.
The U.S. equity valuation measure is the current cyclically adjusted price/earnings (CAPE) ratio percentile relative to our fair-value CAPE estimate for the MSCI US Broad Market Index. Factor valuations are relative to U.S. equities as the base at the 50th percentile. Growth, value, and small-cap valuation measures are all based on the percentile rank based on our fair-value model relative to the market. The large-cap valuation measure is a composite valuation measure of the style factor to U.S. relative valuations and the current U.S. CAPE percentile relative to its fair-value CAPE. The emerging markets valuation measure is based on the percentile rank based on our fair-value model relative to the market. The ex-U.S. developed markets and global ex-U.S. equity valuation measures are the market-capitalization-weighted CAPE percentiles relative to our fair-value CAPE estimate for the MSCI EMU Index, MSCI UK Index, MSCI Japan Index, MSCI Canada Index, MSCI Australia Index, and MSCI Emerging Markets Index; the MSCI Emerging Markets Index is used only for global ex-U.S. equities. Source: Vanguard calculations using data from Robert Shiller’s website at aida.wss.yale.edu/~shiller/data.htm, the U.S. Bureau of Labor Statistics, the Federal Reserve Board, and Refinitiv, as of March 31, 2026.
IMPORTANT INFORMATION
You should consider the FPA Queens Road Small Cap Value Fund and the FPA Crescent Fund (each a “Fund”, and collectively the “Funds”) investment objectives, risks, and charges and expenses carefully before you invest. The prospectus and summary prospectus detail these and other matters of interest to a prospective investor. The prospectus is available at https://fpa.com/resources/ for the FPA Queens Road Small Cap Fund and FPA Crescent Fund, or by email at [email protected], or toll-free by calling 1-800-982-4372. Please read the prospectus carefully before investing.
This communication is for informational and discussion purposes only and does not constitute, and should not be construed as, a recommendation, financial promotion, investment advice, encouragement or an offer or solicitation for the purchase or sale with respect to any securities, products, or services discussed, and neither does it provide investment advice. Any such offer or solicitation shall only be made pursuant to the relevant offering documents for an FPA Fund or other client account, which supersedes the information contained herein in its entirety. This communication does not constitute an investment management agreement or offering circular. The information and data presented has been prepared from sources believed reliable, but the accuracy and completeness of the information cannot be guaranteed and is not a complete summary or statement of all available data. You should not construe the contents of this communication as legal, tax, investment or other advice or recommendations.
Investments, including investments in mutual funds and other investment funds, carry risks and investors may lose principal value. Capital markets are volatile and can decline significantly in response to adverse issuer, political, regulatory, market, or economic developments. Foreign securities are subject to interest rate, currency exchange rate, economic and political risks.
The information contained herein reflects certain opinions and/or views as of the date provided, is subject to change without notice, and may be forward-looking and/or based on current expectations, projections, and/or information currently available. Such information may not be accurate over the long term. Actual results may differ from those anticipated. These opinions/views may differ across the portfolio managers and analysts of the firm as a whole and are not intended to be a forecast of future events, a guarantee of future results, or investment advice. FPA cannot assure future results and disclaims any obligation to update or alter any statistical data and/or references thereto, as well as any forward-looking statements, whether as a result of new information, future events, or otherwise. Future events or results may vary significantly from those expressed and are subject to change at any time in response to changing circumstances and industry developments.
Portfolio composition will change due to active management. References to individual securities or sectors are for informational purposes only and should not be construed as recommendations by the Funds, FPA, the portfolio managers, or the distributor (as applicable). The portfolio holdings as of the most recent quarter-end may be obtained at https://fpa.com/resources/.
The Magnificent 7 (Mag 7) refers to a group of seven large, predominantly technology‑focused U.S. companies such as Alphabet, Amazon, Apple, Meta Platforms, Microsoft, NVIDIA, and Tesla that have had a significant influence on U.S. equity market performance due to their size, growth, and market leadership.
The S&P 493 is an informal term used to describe the performance of the S&P 500 Index excluding the Magnificent 7 stocks, representing the remaining 493 companies in the index and providing a view of broader market trends beyond the largest companies.
The FPA Queens Road Small Cap Value Fund and The FPA Crescent Fund are distributed by Distribution Services, LLC. 190 Middle Street, Suite 301, Portland, ME 04101. Distribution Services, LLC and FPA are not affiliated.