
Bond market pricing continues to be near extremes with both historically attractive real yields and historically unattractive high yield credit spreads.
TIPS 5-Year vs High Yield Bond Spreads (July 2015 to June 2025)
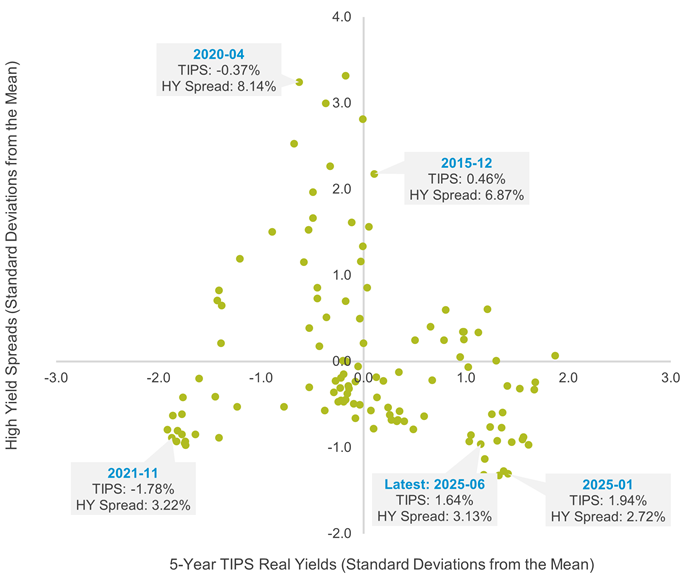
Source: Federal Reserve Economic Data. Market Yield on U.S. Treasury Securities at 5-Year Constant Maturity, Quoted on an Investment Basis, Inflation-Indexed, Percent, Monthly, Not Seasonally Adjusted. ICE BofA BBB U.S. Corporate Index Option-Adjusted Spread, Percent, Monthly, Not Seasonally Adjusted. Past performance is no guarantee of future results.
It is a favorable environment for fixed income investors because you don’t have to take on a lot of credit risk to find attractive yields. We last discussed this topic in our commentary published on April 9, 2025, “Bonds: A Tale of Two Markets.”
Are active bond funds positioned for this unique set up? We believe they are, just not in the way you might think.
Below is a scatter chart of the 20 largest actively managed short-term bond funds. In the center is the largest index fund in the category.
Standard Deviation from Index: Duration & Credit Quality (AAA, AA, and A)
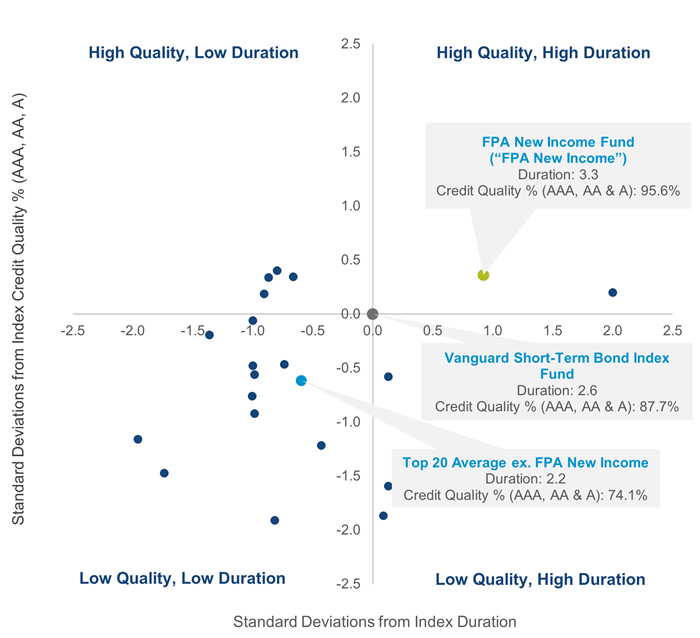
As of June 30, 2025
Source: Morningstar Direct. “Index” represented by the Vanguard Short-Term Bond Index Fund. The plot points in the chart represent the top 20 largest funds in the Morningstar Short-term Bond category. Data as of 6/30/2025. Past performance is no guarantee of future results.
In terms of credit quality, the vast majority of the funds (14 out of 20 or 70%) have a lower credit profile than the index (their dot is below the X axis). Looking at interest rate risk, the vast majority of funds (15 out of 20 or 75%) have a lower duration than the index (their dot is to the left of the Y axis).
This is the exact opposite of what one might expect: these funds are taking excess credit risk despite tight credit spreads and are taking less interest rate risk despite high real yields (and the prospect of the Federal Reserve cutting the Fed Funds rate according to market pricing).
Contrast this positioning with FPA New Income – it is one of only two funds in the upper right quadrant, meaning it has a higher credit profile AND higher duration than the index.
This isn’t the first time FPA New Income has been positioned differently than its peers. As of the end of 2021, when rates were near ~0%, FPA New Income had a duration of 1.39 years while the Morningstar U.S. Short-Term Bond Category peers had an average duration of 2.75 years.
If you have any questions, please reach out to us directly through this form to dive deeper into the active management process of the FPA New Income Fund.
Important Disclosures
FPA New Income Fund Performance Returns as of 6/30/2025:
1 Year: 7.12%; 5 Years: 3.02%; 10 Years: 2.69%; Since Inception: 6.22%.
Fund performance shown is for the Institutional Class shares. Inception date for the FPA New Income Fund (the “Fund”) was July 11, 1984. Periods greater than one year are annualized. Past performance is no guarantee of future results and current performance may be higher or lower than the performance shown. This data represents past performance and investors should understand that investment returns and principal values fluctuate, so that when you redeem your investment it may be worth more or less than its original cost. Visit the Fund’s website at fpa.com or call toll-free, 1-800-982-4372, for current month-end performance data. The Fund’s Total Annual Fund Operating Expenses before reimbursement (as of the most recent prospectus) is 0.58% for the Institutional Class and 0.78% for the Investor Class. First Pacific Advisors, LP (“FPA” or the “Adviser”) has contractually agreed to reimburse the Fund for Total Annual Fund Operating Expenses (excluding interest, taxes, brokerage fees and commissions payable by the Fund in connection with the purchase or sale of portfolio securities, and extraordinary expenses, including litigation expenses not incurred in the Fund’s ordinary course of business) in excess of 0.454% of the average daily net assets of the Institutional Class shares of the Fund through January 31, 2026, and in excess of 0.554% of the average daily net assets of the Investor Class shares of the Fund through January 31, 2026. This agreement may only be terminated earlier by the Fund’s Board of Trustees (the “Board”) or upon termination of the Advisory Agreement. In addition, the Adviser has voluntarily agreed to waive the advisory fee it receives from the Fund by 0.046% through January 31, 2026 of the Fund’s average daily net assets. FPA will not seek recoupment of the advisory fees voluntarily waived.
This communication is for informational and discussion purposes only and does not constitute, and should not be construed as, a recommendation, financial promotions, investment advice, encouragement or an offer or solicitation for the purchase or sale with respect to any securities, products, or services discussed, and neither does it provide investment advice. Any such offer or solicitation shall only be made pursuant to the relevant offering documents for an FPA Fund or other client account, which supersedes the information contained herein in its entirety. This communication does not constitute an investment management agreement or offering circular. The information and data presented has been prepared from sources believed reliable, but the accuracy and completeness of the information cannot be guaranteed and is not a complete summary or statement of all available data. You should not construe the contents of this communication as legal, tax, investment or other advice or recommendations.
You should consider the Fund’s investment objectives, risks, and charges and expenses carefully before you invest. The Prospectus for the Fund details the Fund’s objective and policies, charges, and other matters of interest to the prospective investor. Please read the relevant Fund’s Prospectus carefully before investing. The Prospectus for the Fund may be obtained by visiting the website at fpa.com, by email at [email protected], toll-free by calling 1-800-982-4372 or by contacting each Fund in writing.
Any Fund data included herein represents past performance and investors should understand that investment returns and principal values fluctuate, so that when you redeem your investment it may be worth more or less than its original cost. As with any investment, there is always the potential for gain, as well as the possibility of loss.
Abhijeet Patwardhan has been portfolio manager for the FPA New Income Fund since November 2015. Thomas Atteberry managed/co-managed FPA New Income Fund from November 2004 through June 2022. Effective July 1, 2022, Mr. Atteberry transitioned to a Senior Advisory role. There were no material changes to the investment process due to this transition. Effective September 30, 2023, Mr. Atteberry no longer acts as Senior Advisor to the Funds, but he remains as Senior Advisor to FPA.
The information contained herein reflects certain opinions and/or views as of the date provided, is subject to change without notice, and may be forward-looking and/or based on current expectations, projections, and/or information currently available. Such information may not be accurate over the long term. Actual results may differ from those anticipated. These opinions/views may differ across the portfolio managers and analysts of the firm as a whole and are not intended to be a forecast of future events, a guarantee of future results, or investment advice. FPA cannot assure future results and disclaims any obligation to update or alter any statistical data and/or references thereto, as well as any forward-looking statements, whether as a result of new information, future events, or otherwise. Future events or results may vary significantly from those expressed and are subject to change at any time in response to changing circumstances and industry developments.
Investments carry risks and investors may lose principal value. Capital markets are volatile and can decline significantly in response to adverse issuer, political, regulatory, market, or economic developments. FPA Funds and client accounts may purchase foreign securities, which are subject to interest rate, currency exchange rates, economic and political risks. The securities of smaller, less well-known companies can be more volatile than those of larger companies.
The return of principal in a bond fund or account is not guaranteed. Bond funds or accounts have the same issuer, interest rate, inflation, and credit risks that are associated with underlying bonds owned by the fund. Lower-rated bonds, convertible securities, and other types of debt obligations involve greater risks than higher-rated bonds.
Interest rate risk is when interest rates go up, the value of fixed income securities, such as bonds, typically go down and investors may lose principal value. Credit risk is the risk of loss of principal due to the issuer’s failure to repay a loan. Generally, the lower the quality rating of a security, the greater the risk that the issuer will fail to pay interest fully and return the principal in a timely manner. If an issuer defaults the security may lose some or all of its value. Convertible securities are generally not investment grade and are subject to greater credit risk than higher-rated investments. High-yield securities can be volatile and subject to much higher instances of default. High yield securities, senior loans, private placements, or restricted securities may carry liquidity risks.
The rating agencies that provide ratings are Standard and Poor’s, Moody’s, Fitch, DBRS, Kroll, and any other Nationally Recognized Statistical Ratings Organization (NRSRO). Credit ratings range from AAA (highest) to D (lowest). Bonds rated BBB or above are considered investment grade. Credit ratings BB and below are lower-rated securities (junk bonds). High-yielding, non-investment-grade bonds (junk bonds) involve higher risks than investment-grade bonds. Bonds with credit ratings of CCC or below have high default risk.
Value style investing presents the risk that the holdings or securities may never reach their full market value because the market fails to recognize what the portfolio management team considers the true business value or because the portfolio management team has misjudged those values. In addition, value style investing may fall out of favor and underperform growth or other styles of investing during given periods.
Please refer to the Fund’s Prospectus for a complete overview of the Fund’s primary risks.
Glossary of Terms
Duration is a measure of the sensitivity of the price (the value of principal) of a fixed-income investment to a change in interest rates.
Standard Deviation is a measure of dispersion of portfolio’s return relative to its mean and is calculated as the square root of the variance.
Index Definitions
Comparison to any index is for illustrative purposes only and should not be relied upon as a fully accurate measure of comparison. The Strategies/Funds will be less diversified than the indices noted herein and may hold non-index securities or securities that are not comparable to those contained in an index. Indices will hold positions that are not within each Strategy’s/Fund’s investment strategy. Indices are unmanaged, do not reflect any commissions, fees, or expenses which would be incurred by an investor purchasing the underlying securities. The Strategies/Funds noted herein do not include outperformance of any index or benchmark in its investment objectives. Investors cannot invest directly in an index.
ICE BofA Merrill Lynch U.S. Corporate BBB Index, is a subset of the ICE BofA ML U.S. Corporate Master Index tracking the performance of US dollar denominated investment grade rated corporate debt publicly issued in the US domestic market. This subset includes all securities with a given investment grade rating BBB.
Bloomberg U.S. Corporate High Yield Bond Index measures the market of USD-denominated, non-investment grade, fixed-rate, taxable corporate bonds.
Morningstar Short-term Bond portfolios invest primarily in corporate and other investment-grade U.S. fixed-income issues and typically have durations of 1.0 to 3.5 years. These portfolios are attractive to fairly conservative investors, because they are less sensitive to interest rates than portfolios with longer durations. Morningstar calculates monthly breakpoints using the effective duration of the Morningstar Core Bond Index in determining duration assignment. Short-term is defined as 25% to 75% of the three-year average effective duration of the MCBI. As of June 30, 2025, there were 561 funds in this category.
The FPA Funds are distributed by Distribution Services, LLC, 190 Middle Street, Suite 301, Portland, ME 04101. Distribution Services, LLC and FPA are not affiliated.