
Dear Shareholder:
Performance Overview
Source Capital’s (“Source” or “Fund”) net asset value (NAV) gained 1.75% for the quarter and 7.78% for the trailing twelve months, which is higher than the balanced MSCI ACWI/Bloomberg US Agg index, the Fund’s primary illustrative benchmark.
Performance versus Illustrative Indices (%)1
| Q1 2025 | Trailing 12-month | |
|---|---|---|
| Source Capital – NAV | 1.75 | 7.78 |
| 60% MSCI ACWI / 40% BBG US Agg | 0.34 | 6.30 |
| 60% S&P 500 / 40% BBG US Agg | -1.45 | 7.02 |
The Fund’s risk exposure is fairly balanced between Equities and Credit, as reflected in the following table.
Portfolio Exposure (%)2
| Q1 2025 | |
|---|---|
| Equity | |
| Common Stocks | 38.1 |
| Total Equity | 38.1 |
| Credit | |
| Public | 20.2 |
| Private (invested assets only) | 19.4 |
| Total Credit | 39.5 |
| Other Limited Partnerships | 4.2 |
| Other | 0.0 |
| Cash and Equivalents | 18.2 |
| Total | 100 |
¹ Comparison to the indices is for illustrative purposes only. An investor cannot invest directly in an index. Fund shareholders may only invest or redeem their shares at market value (NYSE: SOR), which may be higher or lower than the Fund’s net asset value (NAV).
² Source: FPA, as of March 31, 2025. Portfolio composition will change due to ongoing management of the Fund. Cashincludes the non-invested portion of private credit investments. Totals may not add up to 100% due to rounding.
Past performance is no guarantee, nor is it indicative, of future results.
Portfolio Discussion3
Equity
We spoke to generally high stock valuations, particularly in the US, in the Fund’s 2024 year-end commentary. We took advantage of higher prices and reduced and sold some of our positions.
With respect to the recent performance of the Fund, in the previous twelve months, Source’s top five equity performers contributed 2.41% to its return while its bottom five detracted 1.50%.
Trailing Twelve-Month Contributors and Detractors as of March 31, 2025 (%)4
| Top 5 | Performance Contribution | Percent of Portfolio | Bottom 5 | Performance Contribution | Percent of Portfolio |
|---|---|---|---|---|---|
| Holcim | 0.59 | 2.5 | Glencore | -0.40 | 1.1 |
| Kinder Morgan | 0.51 | 0.8 | Ferguson Enterprises | -0.33 | 1.1 |
| Wells Fargo | 0.50 | 1.5 | Comcast Corporation | -0.31 | 2.2 |
| Citigroup | 0.44 | 2.2 | LG | -0.25 | 0.7 |
| Howmet Aerospace | 0.37 | 0.5 | Samsung C&T | -0.22 | 0.5 |
| 2.41 | 7.6 | -1.50 | 5.7 |
³ References to individual securities are for informational purposes only, are subject to change, and should not be construed as a recommendation or a solicitation to buy or sell a particular security. Portfolio composition will change due to ongoing management of the Fund. Portfolio holdings for the Fund can be found at fpa.com.
⁴ Reflects the top five contributors and detractors to the Fund’s performance based on contribution to return for the trailing twelve months (“TTM”). Contribution is presented gross of investment management fees, transactions costs, and Fund operating expenses, which if included, would reduce the returns presented. The information provided does not reflect all positions purchased, sold or recommended by FPA during the quarter. A copy of the methodology used and a list of every holding’s contribution to the overall Fund’s performance during the TTM is available by contacting FPA Client Service at [email protected]. It should not be assumed that recommendations made in the future will be profitable or will equal the performance of the securities listed.
While we reviewed many of the above contributors and detractors in the last year, Kinder Morgan had some favorable events that we believe helped drive its stock price higher—a consensus developed that AI data centers will require a significant increase in US natural gas consumption; the new administration reversed the previous ban on LNG development; and the company materially increased its backlog of financially attractive development projects.5 In addition to these positive external developments, solid operating performance and continued exemplary corporate management contributed to strong stock performance. Other than Kinder Morgan, no significant news drove the prices of the other contributors or detractors during the trailing twelve months.6
While the Fund’s first and third quarter commentaries typically communicate performance and some of the names that drove it over the last year, even that seems less pertinent today given recent market volatility associated with the moving target of what tariffs will or won’t be. We have no idea where things will end up – our tariffs or that of our trading partners – which feeds investor’s insecurity. You have not entrusted us with your hard-earned capital to opine on public policy but rather to do the best with the hand we are dealt. The markets respond fearfully to uncertainty, but nothing is ever certain. In strong economic environments and stock markets, complacency creates false confidence, but when negative news headlines raise more questions than answers, investors often assume the worst. We never would have imagined we would have had to deal with the Great Financial Crisis, a pandemic, or a global trade war, but that is why we have always endeavored to invest with a margin of safety with a focus on preparation for the unknown rather than trying to predict the uncertain.
5January 21, 2025. U.S. Department of Energy Reverses Biden LNG Pause, Restores Trump Energy Dominance Agenda | Department of Energy (https://www.energy.gov/articles/us-department-energy-reverses-biden-lng-pause-restores-trump-energy-dominance-agenda). LNG is Liquid Natural Gas.
6Historical commentaries for the Fund can be accessed here on the fpa.com website
Past performance is no guarantee, nor is it indicative, of future results.
Fixed Income
Traditional
High yield bond spreads increased during the quarter, but from a low base, as reflected in the following chart. The spread on the Bloomberg US Corporate High Yield Index increased by 61 bps to 374 bps, ending the quarter at the 22nd percentile. The spread on the Bloomberg US Corporate BB High Yield Index, excluding Energy, increased by 47 bps to 240 bps, ending the quarter at the 34th percentile. We often look to that BB component of the high yield index as a more consistent measure of high yield bond market pricing over time because it removes some of the distortions associated with composition changes in the overall high yield index.
Bloomberg US Corporate High-Yield BB ex. Energy Index Yield-To-Worst (YTW) and Spread7
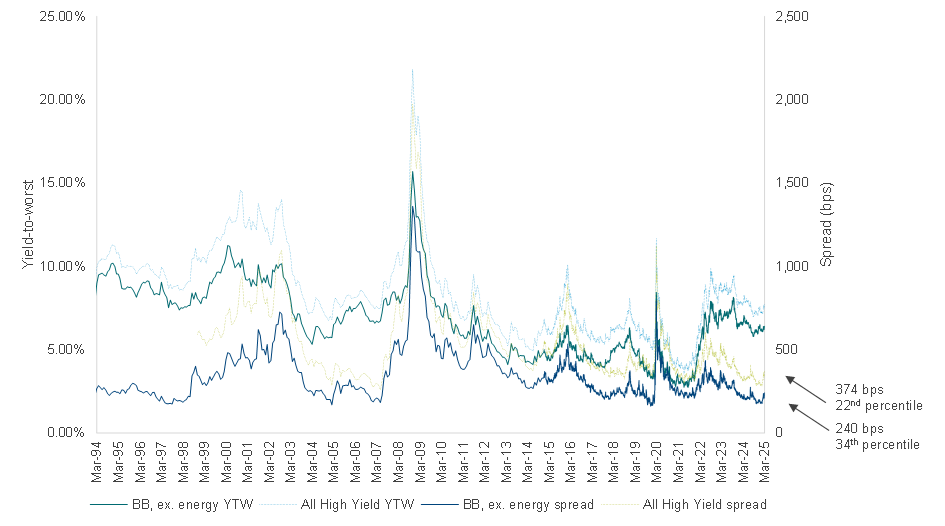
7 Source: Bloomberg. As of March 31, 2025. YTW is Yield-to-Worst. Spread reflects the quoted spread of a bond that is relative to the security off which it is priced, typically an on-the-run Treasury. Please see Important Disclosures for definitions of key terms.
Past performance is no guarantee, nor is it indicative, of future results.
As we evaluated investment opportunities during the quarter, narrow spreads gave us pause. Spreads were low on an absolute basis and relative to history, and the market seemed leveraged to good outcomes with little protection against bad outcomes. Particularly with tariffs on the horizon, we found these low spreads provided inadequate absolute compensation for credit risk. Due to possible tariffs, debt investments now face a broader range of outcomes with potentially greater downsides. In other words, we believe that the scope for both a widening of spreads and a permanent impairment of capital is greater due to the potential negative implications of tariffs for earnings and asset value. Because of inadequate compensation, we did not find attractive investment opportunities in Credit, aside from one investment during the quarter.
Private Credit
Source has 24.8% committed to private credit (including called and uncalled capital). We continue to look for opportunities to increase that exposure.
Corporate & Other
Distribution
On March 20, 2025, the Fund’s Board approved maintaining the current rate of 20.83 cents per share for its regular monthly distribution through May 2025.8 This equates to an annualized 6.02% unlevered distribution rate based on the Fund’s closing market price on March 31, 2025.
Discount to NAV
The Fund’s discount to NAV closed at 4.9% at quarter-end. The average discount to NAV for the trailing twelve months was 5.0%.9
Closing
We continue to monitor the companies we own and those we hope to purchase, fine-tuning models as we prepare for the worst, yet hope for the best.
Respectfully submitted,
Source Capital Portfolio Managers
May 14, 2025
8For more information related to the Fund’s distribution rate, please see the press release dated March 20, 2025 at: https://fpa.com/news-special-commentaries/fund-announcements. Dividends and other distributions are not guaranteed.
9Source: FPA. The average is calculated using daily discount rates.
Past performance is no guarantee, nor is it indicative, of future results.
Important Disclosures
This Commentary is for informational and discussion purposes only and does not constitute, and should not be construed as, an offer or solicitation for the purchase or sale with respect to any securities, products or services discussed, and neither does it provide investment advice. This Commentary does not constitute an investment management agreement or offering circular.
Current performance information is updated monthly and is available by calling 1-800-982-4372 or by visiting fpa.com. Performance data quoted represents past performance, which is no guarantee of future results. Current performance may vary from the performance quoted. The returns shown for Source Capital are calculated at net asset value per share, including reinvestment of all distributions. Returns do not reflect the deduction of taxes that a shareholder would pay on Fund distributions, which would lower these figures. Since Source Capital is a closed-end investment company and its shares are bought and sold on the New York Stock Exchange, your performance may also vary based upon the market price of the common stock.
The Fund is managed according to its investment strategy which may differ significantly in terms of security holdings, industry weightings, and asset allocation from those of the comparative indices. Overall Fund performance, characteristics and volatility may differ from the comparative indices shown.
There is no guarantee the Fund’s investment objectives will be achieved. You should consider the Fund’s investment objectives, risks, and charges and expenses carefully before you invest. You can obtain additional information by visiting the website at fpa.com, by email at [email protected], toll free by calling 1-800-982-4372 or by contacting the Fund in writing.
Effective January 1, 2025, Source Capital, Inc. was reorganized into a Delaware Trust. The Fund’s new name is Source Capital, but it continues to trade on the NYSE under the SOR ticker. There was no change in its investment philosophy, investment strategy, or fundamental investment policies. FPA continues to be the adviser to the Fund. For more information, please refer to the announcement on FPA’s website at https://fpa.com/wp-content/uploads/2025/09/press-release-2024-11.pdf.
The views expressed herein and any forward-looking statements are as of the date of this publication and are those of the portfolio management team. Future events or results may vary significantly from those expressed and are subject to change at any time in response to changing circumstances and industry developments. This information and data has been prepared from sources believed reliable, but the accuracy and completeness of the information cannot be guaranteed and is not a complete summary or statement of available data.
Portfolio composition will change due to ongoing management of the Fund. References to individual financial instruments or sectors are for informational purposes only and should not be construed as recommendations by the Fund or the portfolio managers. It should not be assumed that future investments will be profitable or will equal the performance of the financial instrument or sector examples discussed. The portfolio holdings as of the most recent quarter-end may be obtained at fpa.com.
Investing in closed-end funds involves risk, including loss of principal. Closed-end fund shares may frequently trade at a discount (less than) or premium (more than) to their net asset value. If the Fund’s shares trade at a premium at the most recent value, there is no assurance that any such premium will be sustained for any period of time and will not decrease, or that the shares will not trade at a discount to net asset value thereafter.
Capital markets are volatile and can decline significantly in response to adverse issuer, political, regulatory, market, or economic developments. It is important to remember that there are risks inherent in any investment and there is no assurance that any investment or asset class will provide positive performance over time.
The Fund may purchase foreign securities, including American Depository Receipts (ADRs) and other depository receipts, which are subject to interest rate, currency exchange rate, economic and political risks; these risks may be heightened when investing in emerging markets. Non-U.S. investing presents additional risks, such as the potential for adverse political, currency, economic, social or regulatory developments in a country, including lack of liquidity, excessive taxation, and differing legal and accounting standards. Non-U.S. securities, including American Depository Receipts (ADRs) and other depository receipts, are also subject to interest rate and currency exchange rate risks.
The return of principal in a fund that invests in fixed income instruments is not guaranteed. The Fund’s investments in fixed income instruments have the same issuer, credit risk, inflation, and credit risks that are associated with underlying fixed income instruments owned by the Fund. Such investments may be secured, partially secured or unsecured and may be unrated, and whether or not rated, may have speculative characteristics. The market price of the Fund’s fixed income investments will change in response to changes in interest rates and other factors.
Generally, when interest rates go up, the value of fixed income instruments, such as bonds, typically go down (and vice versa) and inversely so by varying magnitudes. Credit risk is the risk of loss of principal due to a borrower’s failure to repay a loan. Generally, the lower the quality (or rating) of an instrument, the greater the risk that the issuer will fail to pay interest fully and return principal in a timely manner. If an issuer defaults, the security may lose some or all its value. Lower rated bonds, convertible securities and other types of debt obligations may develop additional risks.
Mortgage-related and asset-backed securities are subject to prepayment risk, can be highly sensitive to changes in interest rates, and are subject to credit risk if default on the underlying assets. Convertible securities are generally of lower investment grade and therefore typically entail greater risk than higher-rated investments. High yield securities can be volatile and subject to high yield market risk and default. The Fund may experience increased costs, losses and delays in liquidating underlying securities should the seller of a repurchase agreement declare bankruptcy or default.
The ratings agencies that provide ratings are Standard and Poor’s (“S&P”), Fitch, Moody’s, Kroll, DBRS, and any other nationally recognized statistical rating organization (“NRSRO”). Credit ratings range from AAA (highest) to D (lowest). Bonds rated BBB or above are considered investment grade (IG). Credit ratings of BB and below are lower-rated securities (junk bonds), high-yielding, non-investment grade bonds (junk bonds) involve higher risks than investment grade bonds. Bonds with credit ratings of CCC or below have high default risk.
Private placement securities are securities that are not registered under the federal securities laws and are generally eligible for sale only to certain eligible investors. While private placements may be liquid, and thus more difficult to sell, because there may be relatively few potential purchasers for such investments, and the sale of such investments may also be restricted under securities laws.
The Fund may use leverage. While the use of leverage may help increase the distribution and return potential of the Fund, it also increases volatility and the risk of loss to the net asset value (NAV), and potentially increases variability of distributions and net asset value. There are costs associated with the use of leverage, including ongoing dividend and/or interest expenses. There also may be expenses for issuing or administering leverage. Leverage changes the Fund’s capital structure through the issuance of preferred shares and/or debt, both of which are senior to the common shares in priority of claims. If short-term interest rates rise, the cost of leverage will also likely rise and will reduce returns earned by the Fund’s common stockholders.
Value investing presents the risk that the holdings or securities may never reach their full market value because the market fails to recognize the portfolio management team considering its true business value or because the portfolio management team has overestimated those values. In addition, value style investing may fall out of favor and underperform growth or other styles of investing during given periods.
Distribution Rate
Distributions may include the net income from dividends and interest earned by fund securities, net capital gains, or in certain cases it may include a return of capital. The Fund may also pay a special distribution at the end of a calendar year to comply with federal tax requirements. All mutual funds, including closed-end funds, periodically distribute profits they earn to investors. By law, if a fund earns net gains from the sale of securities, or dividends and interest from securities, it must pass substantially all of those earnings to its shareholders or it will be subject to corporate income taxes and excise taxes. These taxes would, in effect, reduce investors’ total return. First Pacific Advisors, LP does not provide legal, accounting, or tax advice.
The Fund’s distribution rate may be affected by numerous factors, including changes in realized and unrealized market returns, Fund performance, and other factors. There can be no assurance that a change in market conditions or other factors will not result in a change in the Fund’s distribution rate at a future time.
Index Definitions
Comparison to any index is for illustrative purposes only and should not be relied upon as a fully accurate measure of comparison. The Fund may be less diversified than the indices noted herein and may hold non-fund securities or securities that are not comparable to those contained in an index. Indices will hold positions that are not within the Fund’s investment strategy. Indices are unmanaged and do not reflect any commissions, transaction costs, or fees and expenses which would be incurred by an investor purchasing the underlying securities and which would reduce the performance in an actual account. You cannot invest directly in an index. The Fund does not include outperformance of any index in its investment objectives.
S&P 500 Index includes a representative sample of 500 hundred companies in leading industries of the U.S. economy. The Index focuses on the large-cap segment of the market, with over 80% coverage of U.S. equities, but is also considered a proxy for the total market.
MSCI ACWI NR USD Index (MSCI ACWI) is an unmanaged free float-adjusted market capitalization weighted index that is designed to measure the equity market performance of developed and emerging markets. Net Return (NR) indicates that withholding taxes are applied to dividend reinvestments. MSCI uses withholding tax rates applicable to Luxembourg holding companies.
Bloomberg U.S. Aggregate Bond Index provides a measure of the performance of the US investment grade bonds market, which includes investment grade US Government bonds, investment grade corporate bonds, mortgage pass-through securities and asset-backed securities that are publicly offered for sale in the United States. The securities in the Index must have at least 1-year remaining in maturity. In addition, the securities must be denominated in US dollars and must be fixed rate, nonconvertible, and taxable.
Consumer Price Index (CPI) is an unmanaged index representing the rate of inflation of U.S. consumer prices as determined by the U.S. Department of Labor Statistics. The CPI is presented to illustrate the Fund’s purchasing power against changes in the prices of goods as opposed to a benchmark, which is used to compare the Fund’s performance. There can be no guarantee that the CPI will reflect the exact level of inflation at any given time.
60% S&P500 / 40% BBG U.S. Aggregate Bond Index is a hypothetical combination of unmanaged indices and comprises 60% S&P 500 Index and 40% Bloomberg U.S. Aggregate Bond Index.
60% MSCI ACWI / 40% BBG U.S. Aggregate Bond Index is a hypothetical combination of unmanaged indices and comprises 60% MSCI ACWI Index and 40% Bloomberg U.S. Aggregate Bond Index.
Bloomberg U.S. High Yield Index measures the market of USD-denominated, non-investment grade, fixed-rate, taxable corporate bonds.
Bloomberg U.S. High Yield BB ex Energy Index measures the market of USD-denominated, non-investment grade, fixed-rate, taxable BB-rated corporate bonds excluding energy sector.
Glossary of Terms
Discount to Net Asset Value (NAV) is a pricing situation when a closed-end fund’s market trading price is lower than its daily net asset value (NAV).
Dividend Yield is the dividend per share divided by the price per share.
Effective Yield is the total yield on an investment, converted to its nominal yield—which is the stated interest rate of the bond’s coupon.
High Yield (HY) bond is a high paying bond with a lower credit rating (S&P and Fitch, BB+ and lower; Moody’s, Ba1 or lower) than investment-grade corporate bonds, Treasury bonds and municipal bonds. Because of the higher risk of default, these bonds pay a relatively higher yield than investment grade bonds.
Investment Grade (IG) is a rating (S&P and Fitch, BBB– and higher; Moody’s Baa3 and higher) that indicates that a bond has a relatively low risk of default.
Market Capitalization refers to the total dollar market value of a company’s outstanding shares of stock.
Net Asset Value (NAV) represents the net value of a mutual fund and is calculated as the total value of the fund’s assets minus the total value of its liabilities and is shown as a per share price.
Standard Deviation is a measure of the dispersion or spread of data from its mean.
Volatility is a statistical measure of the dispersion of returns for a given security or market index. In most cases, the higher the volatility, the riskier the security. Volatility is often measured as either the standard deviation or variance between returns from that same security or market index.
Spread reflects the quoted spread of a bond that is relative to the security off which it is priced, typically an on-the-run treasury.
Yield is the discount rate that links the bond’s cash flows to its current dollar price
Yield to Worst (YTW) is a measure of the lowest possible yield that can be received on a bond that fully operates within the terms of its contract without defaulting. It is a type of yield that is referenced when a bond has provisions that would allow the issuer to close it before it matures.
©2025 Morningstar, Inc. All Rights Reserved. The information contained herein: (1) is proprietary to Morningstar and/or its content providers; (2) may not be copied or distributed; and (3) is not warranted by Morningstar to be accurate, complete, or timely. Neither Morningstar nor its content providers are responsible for any damages or losses arising from any use of this information. Past performance is no guarantee, nor is it indicative, of future results.