
Not authorized for distribution unless preceded or accompanied by a current prospectus.
Average Annual Total Returns (%)
| As of Date: 12/31/2017 | 30 Years | 20 Years | 15 Years | 10 Years | 5 Years | 3 Years | 1 Year | YTD | QTR |
|---|---|---|---|---|---|---|---|---|---|
| FPA New Income, Inc. | 6.05 | 3.90 | 3.01 | 2.21 | 1.46 | 1.78 | 2.67 | 2.67 | 0.43 |
| BBgBarc US Agg Bond | 6.36 | 4.98 | 4.15 | 4.01 | 2.10 | 2.24 | 3.54 | 3.54 | 0.39 |
| CPI + 100 | 3.60 | 3.18 | 3.11 | 2.63 | 2.42 | 2.61 | 3.05 | 3.05 | 0.90 |
| BBgBarc US Aggregate 1-3 Yr | N/A | 3.45 | 2.41 | 1.95 | 0.86 | 0.95 | 0.86 | 0.86 | -0.20 |
Periods greater than one year are annualized. Performance is calculated on a total return basis which includes reinvestment of all distributions. Comparison to any Index is for illustrative purposes only. The Fund does not include outperformance of any index or benchmark in its investment objectives.
Past performance is no guarantee of future results and current performance may be higher or lower than the performance shown. This data represents past performance and investors should understand that investment returns and principal values fluctuate, so that when you redeem your investment it may be worth more or less than its original cost. The Fund’s expense ratio as of its most recent prospectus is 0.49%. Current month-end performance data may be obtained at www.fpafunds.com or by calling toll-free, 1-800-982 4372.
Please see important disclosures at the end of the commentary.
Key Points
- Rarely do intermediate and high-yield bonds look risky at the same time. However, it appears they are both risky today. Intermediate-term bonds are barely yielding more than short-term bonds, and “high-yield” bonds are not yielding much more than high quality bonds.
- Valuation conditions similar to today’s have only occurred twice in the past twenty years. Subsequent to both of those instances, intermediate-term and high-yield bonds performed poorly.
- This short paper explores why investors should be concerned about these risks and why we believe FPA New Income is well positioned to help investors navigate through them.
Fixed-income investors face potential subpar returns if they do not properly evaluate two aspects of risk: interest rate (or duration1) risk and credit risk.
Interest Rate Risk
Investors must take greater care not to underprice interest rate risk when short- and longer-term bonds have similar yields.
The following graph shows the spread in yields between the two- and ten-year Treasury bond (in blue) and what the market expects inflation to be (in green). The spread between the two- and ten-year Treasury bond is one way of measuring how worried investors are about future inflation and/or rising interest rates. Over the past twenty years, there have only been three instances when the spread has been this low: right before the 2001 and 2007-2009 recessions, and today.
Slope of Yield Curve and 10-Year Implied Inflation
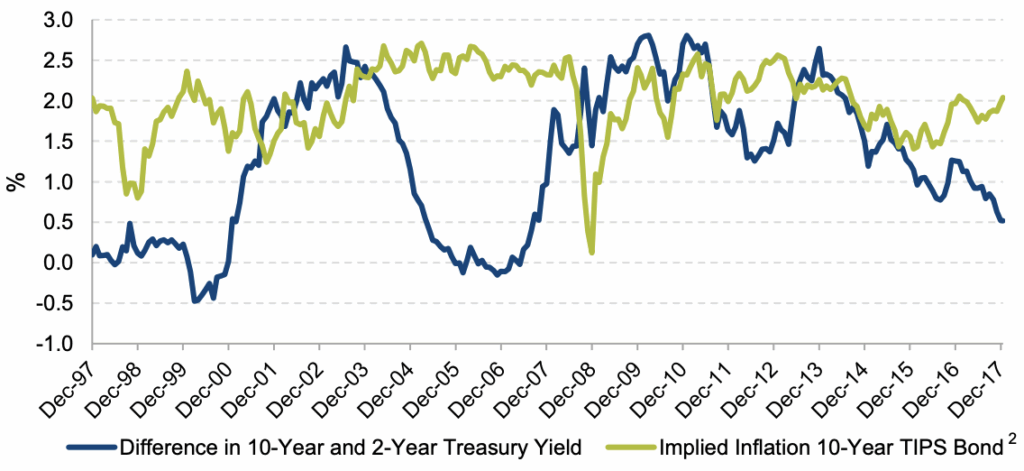
Source: Federal Reserve Bank of St. Louis, Bloomberg
The most logical reason why investors demand little or no extra yield to own longer-term bonds is if they expect a recession or another deflationary event. The problem is that deflation seems unlikely, as evidenced by the market’s growing inflation expectations.
Credit Risk
Investors must also be careful not to underprice credit risk when high-yield bonds do not have 3 compared to investment-grade debt (including Treasuries).
Today, high-yield bonds have near record low yields, both on an absolute basis and relative to Treasuries. Over the past twenty years, there has only been one other time when the yield-to-worst4 has been lower than today’s ~5.8% yield, when yields dipped below 5.3% in 2013. The high-yield market went on to post a 10%+ drawdown over the next two years, while the broader bond market was down less than 5%.
Bloomberg Barclays U.S. Corporate High Yield Index

Current meager credit spreads could make sense, if, for example, leverage had come down (which should lead to fewer defaults), covenant quality had increased (which should lead to better recovery rates), or we were in the early days of the economic cycle5. But, in fact, the opposite is true on all three counts. The two charts below depict the current leverage and covenant quality levels. Investors are getting less protection and being paid worse than normal. That’s a bad deal.
Leveraged increased in Q3 to 5.0x 6

Source: Credit Suisse, the Bloomberg ProfessionalTM service
Moody’s Covenant Quality Indicator (CQI)7
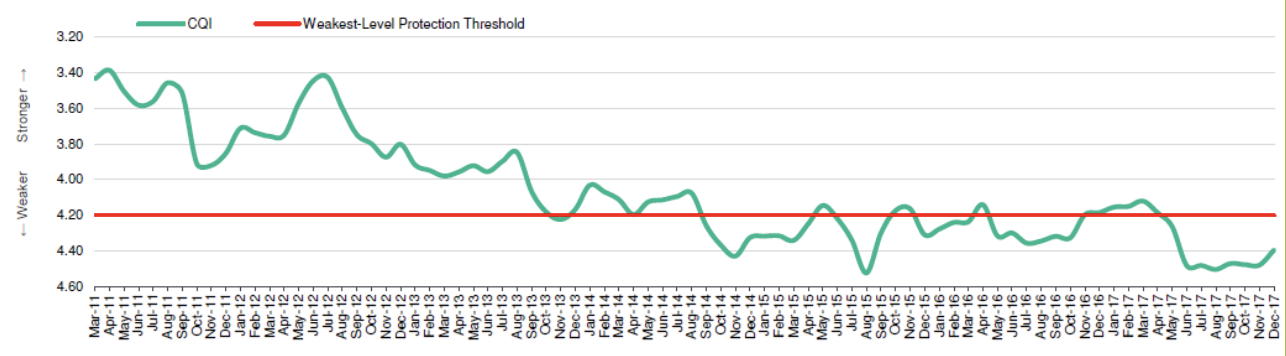
Note: CQI includes all high-yield bonds, including high-yield lite. High-yield bonds lack a debt incurrence and/or restricted payments covenant and automatically receive the weakest possible CQ of 5.0.
Source: Moody’s High Yield Covenant Database
In summary, this is only the third time in the past twenty years when the yield curve has been this flat while at the same time high-yield spreads have been this tight.
Following the last two periods when interest rate and credit risk premiums were similar to those that currently exist, intermediate and high-yield bond investors were well served by reducing risk. This is evidenced by the max drawdown and three-year performance of FPA New Income versus the Bloomberg Barclays U.S. Aggregate and High Yield Indices starting in 1998 and 2005:
| Max Dawdown 1/1/1998-12/31/2000 | Return 1/1/1998-12/31/2000 | Max Drawdown 7/1/2005-6/30/2008 | Return 7/1/2005-6/30/2008 | |
|---|---|---|---|---|
| FPA New Income | -2.39% | 5.49% | -0.27% | 4.87% |
| Bloomberg Barclays US Aggregate Bond Index | -2.54% | 6.36% | -1.81% | 4.09% |
| Bloomberg Barclays US High Yield Corporate Index | -8.78% | -0.53% | -5.68% | 4.54% |
Source: Morningstar Direct.
Our Positioning
In light of these conditions, we have maintained our short duration and continued to reduce credit risk in FPA New Income.
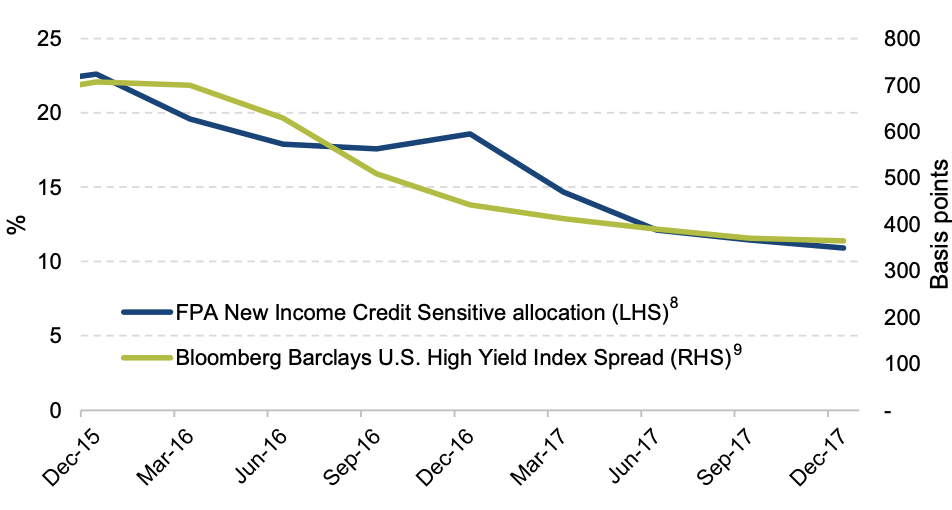
Source: FPA, Bloomberg Barclays
We have also generally avoided the unsecured corporate bonds that make up the portfolio of many other funds in favor of secured bonds which have tended to have similar, if not better, yield and credit risk profiles compared to unsecured corporate bonds.
| Sector Allocation % net (12/31/17) | US Treasury | Corporate Bond | Asset Backed |
|---|---|---|---|
| FPA New Income | 4.7 | 7.9 | 56.8 |
| Morningstar Intermediate-Term Bond Funds | 20.7 | 31.0 | 7.6 |
| Morningstar Short-Term Bond Funds | 14.5 | 38.7 | 15.1 |
Source: FPA, Morningstar Direct
As bottom-up value investors, when our margin of safety starts to evaporate, we prefer less risky investments until bargains come our way again. It’s not a matter of if we will take on more duration or credit risk again, but merely when.
The solution to being inadequately compensated for interest rate and credit risk is straightforward: reduce exposure to these risks until you are paid to take them. Usually the trade-off to reducing risk is accepting a significantly lower yield (and total return) while waiting for better opportunities. The good news is that given the rise in short-term yields, FPA New Income continues to find attractive bonds, and its risk/reward characteristics are better when compared to both the broader and short-term bond market indices:
| Characteristics (12/31/17) | Yield to Worst (%) | Effective Durations (yrs) | YTW/Duration |
|---|---|---|---|
| FPA New Income | 2.95 | 1.47 | 2.01 |
| Bloomberg Barclays US Aggregate Bond Index | 2.71 | 5.98 | 0.45 |
| Bloomberg Barclays US Aggregate 1-3 Year Index | 2.04 | 1.92 | 1.06 |
In closing, now is not the time for fixed income investors to be complacent.
Respectfully submitted,
Thomas H. Atteberry
Portfolio Manager
Abhijeet Patwardhan
Portfolio Manager
Ryan Leggio
Senior Product Specialist
1 Duration is a measure of the sensitivity of the price (the value of principal) of a fixed-income investment to a change in interest rates.
2 Implied inflation is calculated by subtracting TIPS yield from the 10-year maturity Treasury yield.
3 Margin of safety is a principle of investing in which an investor only purchases securities when the market price is significantly below its intrinsic value. In other words, when the market price is significantly below your estimation of the intrinsic value, the difference is the margin of safety. This difference allows an investment to be made with minimal downside risk.
4 Yield-to-worst is the lowest possible yield that can be received on a bond without the issuer actually defaulting. It does not represent the yield that an investor should expect to receive. As of December 31, 2017, the SEC yield was 2.84%. This yield figure reflects the theoretical income that a bond portfolio would generate, including dividends and interest, during the period after deducting the Fund’s expenses for the period (but excluding any fee waivers). The Fund’s actual net earnings for a given period under generally accepted accounting principles may differ from this standardized yield. The SEC yield is expressed as an annual percentage based on the price of the Fund at the beginning of the month.
5 https://www.nber.org/research/business-cycle-dating
6A leverage ratio is any one of several financial measurements that look at how much capital comes in the form of debt (loans), or assesses the ability of a company to meet its financial obligations.
7 A bond covenant is a legally binding term of agreement between a bond issuer and a bond holder. Bond covenants are designed to protect the interests of both parties. Negative or restrictive covenants forbid the issuer from undertaking certain activities; positive or affirmative covenants require the issuer to meet specific requirements.
8 Credit Sensitive allocation is bonds rated BBB+ and below
9 OAS (Option Adjusted Spread) is a measurement of the spread of a fixed-income security rate and the risk-free rate of return, which is adjusted to take into account an embedded option.
Important Disclosures
The views expressed herein and any forward-looking statements are as of the date of the publication and are those of the portfolio management team. Future events or results may vary significantly from those expressed and are subject to change at any time in response to changing circumstances and industry developments. This information and data has been prepared from sources believed reliable, but the accuracy and completeness of the information cannot be guaranteed and is not a complete summary or statement of all available data.
Portfolio composition will change due to ongoing management of the Fund. References to individual securities are for informational purposes only and should not be construed as recommendations by the Fund, the portfolio managers, or the Distributor. It should not be assumed that future investments will be profitable or will equal the performance of the security examples discussed. The portfolio holdings as of the most recent quarter-end may be obtained at www.fpafunds.com.
Investments in mutual funds carry risks and investors may lose principal value.
Interest rate risk is the risk that when interest rates go up, the value of fixed income securities, such as bonds, typically go down and investors may lose principal value. Credit risk is the risk of loss of principal due to the issuer’s failure to repay a loan. Generally, the lower the quality rating of a security, the greater the risk that the issuer will fail to pay interest fully and return principal in a timely manner. If an issuer defaults the security may lose some or all of its value. The return of principal in a bond investment is not guaranteed. Bonds have issuer, interest rate, inflation and credit risks. Lower rated bonds, callable bonds and other types of debt obligations involve greater risks. Mortgage-backed securities and asset-backed securities are subject to prepayment risk and the risk of default on the underlying mortgages or other assets.
Capital markets are volatile and can decline significantly in response to adverse issuer, political, regulatory, market, or economic developments. The Fund may purchase foreign securities, which are subject to interest rate, currency exchange rate, economic and political risks.
Value style investing presents the risk that the holdings or securities may never reach their full market value because the market fails to recognize what the portfolio management team considers the true business value or because the portfolio management team has misjudged those values. In addition, value style investing may fall out of favor and underperform growth or other styles of investing during given periods.
Index / Benchmark Definitions
Bloomberg Barclays Aggregate Index provides a measure of the performance of the U.S. investment grade bonds market, which includes investment grade U.S. Government bonds, investment grade corporate bonds, mortgage pass-through securities and asset-backed securities that are publicly offered for sale in the United States. The securities in the Index must have at least 1 year remaining in maturity. In addition, the securities must be denominated in U.S. dollars and must be fixed rate, nonconvertible, and taxable.
Bloomberg Barclays Aggregate 1-3 Year Index provides a measure of the performance of the U.S. investment grade bonds market, which includes investment grade U.S. Government bonds, investment grade corporate bonds, mortgage pass-through securities and asset-backed securities that are publicly offered for sale in the United States. The securities in the Index must have a remaining maturity of 1 to 3 years. In addition, the securities must be denominated in U.S. dollars and must be fixed rate, nonconvertible, and taxable.
Bloomberg Barclays U.S. Corporate High Yield Index measures the market of USD-denominated, noninvestment grade, fixed-rate, taxable corporate bonds.
The Consumer Price Index (CPI) is an unmanaged index representing the rate of the inflation of U.S. consumer prices as determined by the U.S. Department of Labor Statistics. The CPI is presented to illustrate the Fund’s purchasing power against changes in the prices of goods as opposed to a benchmark, which is used to compare the Fund’s performance. There can be no guarantee that the CPI will reflect the exact level of inflation at any given time.
Indices are unmanaged, do not reflect any commissions or fees which would be incurred by an investor purchasing the underlying securities. Investors cannot invest directly in an index.
The FPA Funds are distributed by UMB Distribution Services, LLC, 235 W. Galena Street, Milwaukee, WI, 53212.