
You should consider the Fund’s investment objectives, risks, and charges and expenses carefully before you invest. You can obtain additional information by visiting the website at fpa.com, by calling toll-free, 1-800-982-4372, or by contacting the Fund in writing.
Average Annual Total Returns (%)
| As of September 30, 2025 | Since 12/1/15* | 5 Yr | 3 Yr | 1 Yr | YTD | QTD | 10 Yr** |
|---|---|---|---|---|---|---|---|
| Source Capital – NAV | 8.14 | 11.21 | 16.25 | 13.76 | 13.54 | 4.59 | 8.60 |
| 60% MSCI ACWI / 40% BBG U.S. Agg | 7.71 | 7.91 | 15.64 | 11.42 | 13.48 | 5.36 | 8.01 |
| 60% S&P 500 / 40% BBG U.S. Agg | 9.61 | 9.62 | 16.71 | 11.67 | 11.43 | 5.66 | 9.99 |
Index data source: Morningstar.
Past performance is no guarantee of future results and current performance may be higher or lower than the performance shown. This data represents past performance and investors should understand that investment returns and principal values fluctuate, so that when you redeem your investment it may be worth more or less than its original cost. Current month-end performance data, which may be lower or higher than the performance data quoted, may be obtained at fpa.com or by calling toll-free, 1-800-982-4372.
Periods greater than one year are annualized. Fund performance is shown net of all fees and expenses. The returns shown for Source Capital are calculated at net asset value per share, including reinvestment of all distributions. Returns do not reflect the deduction of taxes that a shareholder would pay on Fund distributions, which would lower these figures. Since Source Capital is a closed-end investment company and its shares are bought and sold on the New York Stock Exchange, your performance may also vary based upon the market price of the common stock. Comparison to any index is for illustrative purposes only. An investor cannot invest directly in an index. The Fund does not include outperformance of any index or benchmark in its investment objectives.
* On December 1, 2015, the Fund transitioned to a balanced strategy and the current portfolio managers assumed management of the Fund on that date.
** Performance prior to December 1, 2015 reflects the performance of the prior portfolio manager and investment strategy. Performance prior to December 1, 2015 is not indicative of performance for any subsequent periods.
Please see important disclosures at the end of this commentary.
Dear Shareholder:
Performance Overview
Source Capital’s (“Source” or “Fund”) net asset value (NAV) gained 4.59% for the quarter and 13.76% for the trailing twelve months, which is higher than the balanced MSCI ACWI/Bloomberg US Agg index, the Fund’s primary illustrative benchmark, for the trailing twelve months.
Performance versus Illustrative Indices (%)1
| Return | Yield* | ||
|---|---|---|---|
| Q3 2025 | Trailing 12-month | ||
| Source Capital – NAV | 4.59 | 13.76 | 5.27 |
| 60% MSCI ACWI / 40% BBG US Agg | 5.36 | 11.42 | 2.69 |
| 60% S&P 500 / 40% BBG US Agg | 5.66 | 11.67 | 2.41 |
The Fund’s risk exposure is nearly balanced between Equities and Credit, as reflected in the following table.
Portfolio Exposure (%)2
| Q3 2025 | |
|---|---|
| Equity | |
| Common Stocks | 40.6 |
| Total Equity | 40.6 |
| Credit | |
| Public | 13.7 |
| Private (invested assets only) | 20.6 |
| Total Credit | 34.3 |
| Other Limited Partnerships | 4.3 |
| Other | 0.1 |
| Cash and Equivalents | 20.8 |
| Total | 100 |
¹ Comparison to the indices is for illustrative purposes only. An investor cannot invest directly in an index. Fund shareholders may only invest or redeem their shares at market value (NYSE: SOR), which may be higher or lower than the Fund’s net asset value (NAV).
* Source: FPA, FactSet, Bloomberg. As of September 30, 2025. The “yield” shown for the Fund is the NAV distribution yield (also referred to as the Fund’s “distribution rate” as a % of NAV). Dividend yield is used for the MSCI ACWI and the S&P 500. Yield to Worst is used for the Bloomberg US Agg.Please refer to the Important Disclosures for definitions of the different measures of yield used in this table. For more information related to the Fund’s distribution rate, please see https://fpa.com/funds/overview/source-capital. Dividends and other distributions are not guaranteed.
² Source: FPA, as of September 30, 2025. Portfolio composition will change due to ongoing management of the Fund. Cash includes the non-invested portion of private credit investments. Totals may not add up to 100% due to rounding.
Portfolio Discussion3
Equity
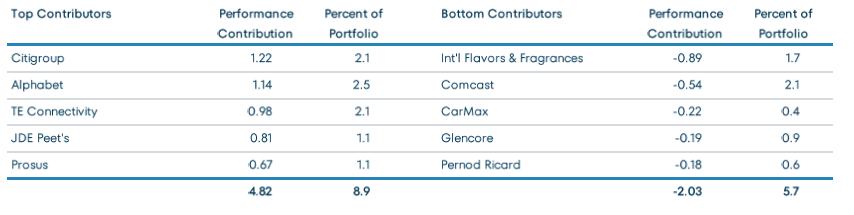
With respect to the recent performance of the Fund, in the previous twelve months, Source’s top five equity performers contributed 4.82% to its return while its bottom five detracted 2.03%.
Trailing Twelve-Month Top and Bottom Contributors (%) as of September 30, 20254
³ References to individual securities are for informational purposes only, are subject to change, and should not be construed as a recommendation or a solicitation to buy or sell a particular security. Portfolio composition will change due to ongoing management of the Fund. Portfolio holdings for the Fund can be found at fpa.com.
⁴ Reflects the top five contributors and detractors to the Fund’s performance based on contribution to return for the trailing twelve months (“TTM”). Contribution is presented gross of investment management fees, transactions costs, and Fund operating expenses, which if included, would reduce the returns presented. Percent of portfolio reflects the average position size over the period. The information provided does not reflect all positions purchased, sold or recommended by FPA during the quarter. A copy of the methodology used and a list of every holding’s contribution to the overall Fund’s performance during the TTM is available by contacting FPA Client Service at [email protected]. It should not be assumed that recommendations made in the future will be profitable or will equal the performance of the securities listed.
The following companies have notably impacted portfolio performance.⁵
Citigroup has improved its return on tangible equity (ROTE) compared to industry peers. In addition, regulatory changes in the US have increased the normal level of ROTE for US-based banks. The combination of a low starting valuation, demonstrated operating improvement, and an improved regulatory environment have resulted in strong share-price performance over the past twelve months.
Despite anxiety about Alphabet’s future that has colored investors’ views of the company, its stock price has risen five-fold since our initial purchases from the time your current PM team assumed management of the Fund. Recent concerns include competitive threats in search, stemming from competing AI models, as well as antitrust scrutiny in the US and Europe. Additionally, there is an open question about the likely return on the billions spent on moonshot investments, among other issues. Its stock has risen 28% year-to-date and 57% since the end of Q1, when it was one of the Fund’s larger performance detractors in the trailing-twelve-month period, mainly due to a judge’s Q3 ruling that declined to force a breakup of Chrome and Android. While legal and competitive challenges persist, Alphabet continues to enhance its existing search offering with new AI features that have been well-received and are continually evolving. Meanwhile, YouTube is now the most-watched media outlet on the planet, with more than one trillion hours of video viewed, and arguably remains under monetized. We expect its cloud offering to continue to grow and eventually achieve the higher margins of its larger peers. Furthermore, the value of Waymo’s leading self-driving technology is evident to those of us at FPA who have experienced its autonomous ride-share service, and its bright future is likely not fully reflected in its stock price. The Fund therefore continues to maintain a position in Alphabet, although we have sold some shares over time.
JDE Peet’s is a pure-play coffee and tea company, with a presence in over 100 markets and a portfolio of 50+ brands. Following a period of material underperformance, JDE Peet’s changed management and agreed to be acquired by Keurig Dr. Pepper. The combination of improved management and agreement to sell the business led to strong performance over the past twelve months.
International Flavors & Fragrances (IFF) is a leading producer of ingredients for food, beverage, personal care, health, and household products industries. Its products are ubiquitous across many household staples, including the enzyme used in half of cold-water laundry detergents, another enzyme used in one-fifth of the global beer market, and one-third of yogurts use an IFF culture. IFF has faced challenges: its prior management was unfortunately reckless in capital allocation, making poor acquisitions and failing to manage its diverse global enterprise effectively. This transformed a high-margin, unlevered company into one with a lower margin and greater leverage. However, a new CEO has renewed the company’s focus on being best-in-class operationally, with a smaller suite of products. IFF has sold and is expected to continue to sell non-core assets, which would decrease the firm’s leverage and likely improving margins. The company has burned investors, leading many to adopt a wait-and-see attitude. IFF’s current ~$4 of free cash flow could increase to $5-6 in a few years, and if successful, its P/E ratio should also rise to be more in line with its peers. With its stock currently at $61, we don’t see much downside and, should IFF execute well, we can reasonably see a path to the stock price doubling over the next few years (inclusive of its free cash flow).6
CarMax, the largest retailer of used cars in the US, has been a disappointment. We entered 2025 with hopes that an improved omnichannel offering in an improving used vehicle market would drive increased sales volumes, market share, and profit growth. Instead, we’ve watched management make a series of missteps. The company withdrew its 2030 unit sales targets at the beginning of the year, citing tariff-related uncertainty expected to have little impact five years from now—not particularly confidence-boosting, especially when their competitors retained their stated medium-term goals. Management mistakenly expected their strong fiscal first quarter to continue. They overbought inventory at elevated prices, which they were then forced to work through in the second quarter, causing them to lose market share. Investors have punished the company for its mistakes, and shares have declined by 47% year to date. Despite our disappointment in management’s execution, the company’s share price appears inexpensive to us. CarMax trades for roughly 12x forward consensus earnings and 1.1x tangible book value. Two independent directors bought shares in early October, seemingly supporting that view. The company also increased its share repurchase program, though we wish they would have held off on repurchases until the market was aware of the current disappointing news. We still believe that CarMax has built a differentiated used vehicle retail business and could see substantial share price improvement if the company rights itself, but operational execution needs to significantly improve.
5 Historical commentaries for the Fund can be accessed here on the fpa.com website. The company data and statistics referenced in this section, including competitor data, are sourced from company press releases, investor presentations, financial disclosures, SEC filings, or company websites, unless otherwise noted.
6 As relates to IFF: Projections on consensus future free cash earnings are based on FPA’s analysis of the last 12 months’ actual and forward-looking consensus estimates. FPA has applied a range of $5.50-6.00 for free cash earnings based on forward-looking free cash earnings, which is lower than the current consensus for those same periods. Based on these three inputs ((a) consensus future free cash flow earnings, (b) conservative P/E metrics relative to IFF’s peer group, and (c) FPA analysis based on IFF company financials), FPA believes that it is possible that the IFF stock price could double in the next few years. Although we believe this estimate has a reasonable basis, it is hypothetical and not guaranteed.
Past performance is no guarantee, nor is it indicative, of future results.
Fixed Income
Traditional
Aside from one investment during the quarter, we did not generally view Credit (investments rated BBB or lower) as attractively priced. We seek to opportunistically invest in Credit when we believe prices adequately compensate for the risk of permanent impairment of capital and near-term mark-to-market risk.
For the past several months, we have had to navigate a market with very low spreads. Indeed, the high-yield market was historically expensive. The following chart shows the yield and spread on the Bloomberg High Yield Index and the BB component of the Bloomberg High Yield Index, excluding energy. We find the latter index to be a better directional measure of high-yield prices because it removes some of the distortions caused by compositional changes in the broader index over time.
Bloomberg U.S. Corporate High-Yield and BB ex. Energy Index Yield-To-Worst (YTW) and Spread7
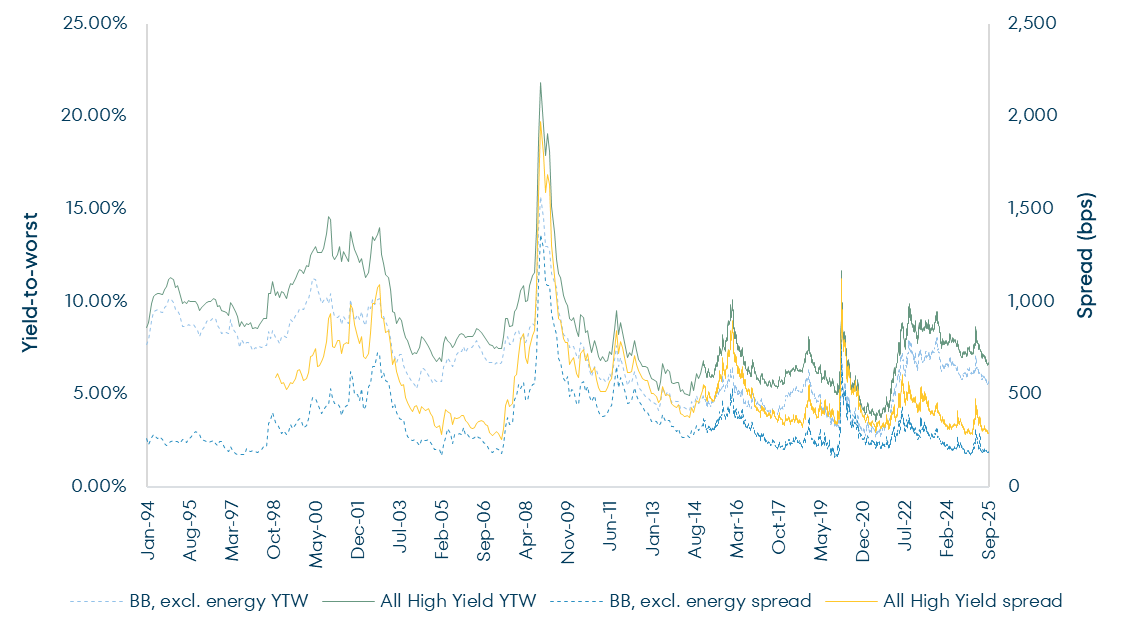
7 Source: Bloomberg. As of September 30, 2025. YTW is Yield-to-Worst. Spread reflects the quoted spread of a bond that is relative to the security off which it is priced, typically an on the-run Treasury. Please see Important Disclosures for definitions of key terms. Past performance is no guarantee, nor is it indicative, of future results.
At 297 bps, spreads on the High Yield Index ended the quarter at the third percentile, while the BB component shown above ended the quarter at 192 bps or the fifth percentile.
Low spreads expose investors to the risk of uncompensated losses from credit-related impairments. Low spreads also introduce greater exposure to mark-to-market losses if and when bonds reprice to wider spreads because of idiosyncratic issues or exogenous events. We don’t know what that exogenous event might be – perhaps a recession, war, lurching government policy, credit contagion, fear of endemic fraud, or a pandemic, just to name a few possibilities. What we do know is that, historically, markets priced on the assumption of perfection tend not to do well when reality ends up being imperfect.
Further, the excess return that one can expect when buying debt at low spreads is unappealing in our view. The chart below shows the forward one-year return on the Bloomberg High Yield Index in excess of the return on similar-duration Treasuries versus the spread on that high-yield index at the start of each year. Historically, the average excess return has been negative when the starting spread is less than 300 bps. As noted above, the spread on the Bloomberg High Yield Index ended the quarter at 297 bps.
High Yield Spread vs. Forward Excess Return8
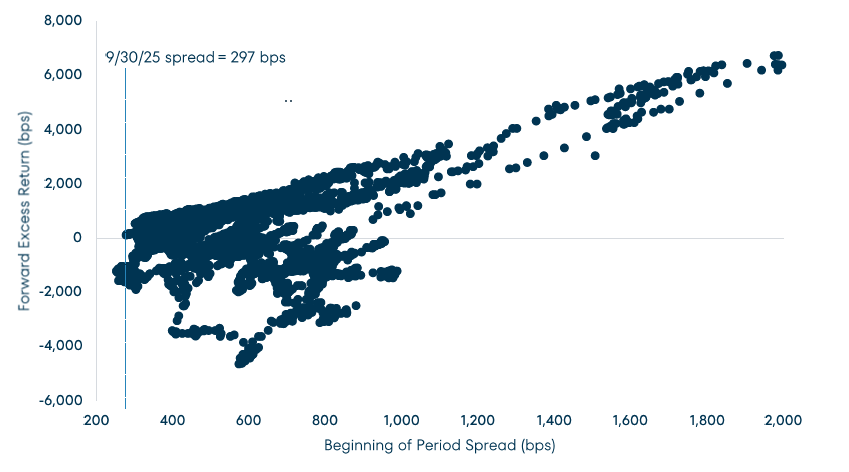
8 Source: Bloomberg; As of September 30, 2025. Chart covers the period 11/27/98 to 9/30/24 and shows the forward one-year return on the Bloomberg U.S. Corporate High Yield Index in excess of the return on similar duration Treasuries versus the starting spread on that high yield index at the start of each one-year period. Please see Important Disclosures for definitions of key terms. Past performance is no guarantee, nor is it indicative, of future results.
Private Credit
Source has 25.6% committed to private credit (including called and uncalled capital) as of quarter-end. We continue to look for opportunities to increase that exposure.
Corporate & Other
Distribution
On August 22, 2025, the Fund’s Board approved maintaining the current rate of 20.83 cents per share for its regular monthly distribution through August 2025.9 This equates to an annualized unlevered distribution rate of 5.55% based on the Fund’s closing market price on September 30, 2025.
Discount to NAV
The Fund’s discount to NAV closed at 5.04% at quarter-end. The average discount to NAV for the trailing twelve months was 4.84%.10
Closing
While the world changes around us and investors’ interpretations of those shifts swing markets, we maintain a continuity that has been our hallmark for more than a decade. As Robert Plant sang, “The Song Remains the Same.” Day in and day out, our research team seeks to improve our understanding of the best global businesses while selectively conducting work on more episodic commercial opportunities. We look forward to sharing a more detailed view of our portfolio positioning and the factors that influence it in our year-end commentary. Until then.
Respectfully submitted,
Source Capital Portfolio Managers
November 7, 2025
9 For more information related to the Fund’s distribution rate, please see the https://fpa.com/funds/overview/source-capital. Dividends and other distributions are not guaranteed.
10 Source: FPA. The average is calculated using daily discount rates.
Past performance is no guarantee, nor is it indicative, of future results.
Important Information
This Commentary is for informational and discussion purposes only and does not constitute, and should not be construed as, an offer or solicitation for the purchase or sale with respect to any securities, products or services discussed, and neither does it provide investment advice. This Commentary does not constitute an investment management agreement or offering circular.
Current performance information is updated monthly and is available by calling 1-800-982-4372 or by visiting fpa.com. Performance data quoted represents past performance, which is no guarantee of future results. Current performance may vary from the performance quoted. The returns shown for Source Capital are calculated at net asset value per share, including reinvestment of all distributions. Returns do not reflect the deduction of taxes that a shareholder would pay on Fund distributions, which would lower these figures. Since Source Capital is a closed-end investment company and its shares are bought and sold on the New York Stock Exchange, your performance may also vary based upon the market price of the common stock.
The Fund is managed according to its investment strategy which may differ significantly in terms of security holdings, industry weightings, and asset allocation from those of the comparative indices. Overall Fund performance, characteristics and volatility may differ from the comparative indices shown.
There is no guarantee the Fund’s investment objectives will be achieved. You should consider the Fund’s investment objectives, risks, and charges and expenses carefully before you invest. You can obtain additional information by visiting the website at fpa.com, by email at [email protected], toll free by calling 1-800-982-4372 or by contacting the Fund in writing.
Effective January 1, 2025, Source Capital, Inc. was reorganized into a Delaware Trust. The Fund’s new name is Source Capital, but it continues to trade on the NYSE under the SOR ticker. There was no change in its investment objective, investment strategy, or fundamental investment policies. FPA continues to be the adviser to the Fund. For more information, please refer to the announcement on FPA’s website at: https://fpa.com/wp-content/uploads/2025/09/press-release-2024-11.pdf.
The views expressed herein and any forward-looking statements are highly speculative, current only as of the date of this publication and are those of the portfolio management team. Forward-looking statements can be identified by the use of terms such as “may”, “will”, “should”, “expect”, “anticipate”, “project”, “estimate”, “intend”, “continue” or “believe” (or the negatives thereof) or other variations thereof. Due to various risks and uncertainties, actual events or results or actual performance may differ materially and are subject to change at any time in response to changing circumstances and industry developments. This information and data has been prepared from sources believed reliable, but the accuracy and completeness of the information cannot be guaranteed and is not a complete summary or statement of all available data. FPA does not undertake to update any forward-looking statement because of new information, future developments, or otherwise.
Portfolio composition will change due to ongoing management of the Fund. References to individual financial instruments or sectors are for informational purposes only and should not be construed as recommendations by the Fund or the portfolio managers. It should not be assumed that future investments will be profitable or will equal the performance of the financial instrument or sector examples discussed. The portfolio holdings as of the most recent quarter-end may be obtained at fpa.com.
Investing in closed‐end funds involves risk, including loss of principal. Closed‐end fund shares may frequently trade at a discount (less than) or premium (more than) to their net asset value. If the Fund’s shares trade at a premium to net asset value, there is no assurance that any such premium will be sustained for any period of time and will not decrease, or that the shares will not trade at a discount to net asset value thereafter.
Capital markets are volatile and can decline significantly in response to adverse issuer, political, regulatory, market, or economic developments. It is important to remember that there are risks inherent in any investment and there is no assurance that any investment or asset class will provide positive performance over time.
The Fund may purchase foreign securities, including American Depository Receipts (ADRs) and other depository receipts, which are subject to interest rate, currency exchange rate, economic and political risks; these risks may be heightened when investing in emerging markets. Non‐U.S. investing presents additional risks, such as the potential for adverse political, currency, economic, social or regulatory developments in a country, including lack of liquidity, excessive taxation, and differing legal and accounting standards. Non‐U.S. securities, including American Depository Receipts (ADRs) and other depository receipts, are also subject to interest rate and currency exchange rate risks.
The return of principal in a fund that invests in fixed income instruments is not guaranteed. The Fund’s investments in fixed income instruments have the same issuer, interest rate, inflation and credit risks that are associated with underlying fixed income instruments owned by the Fund. Such investments may be secured, partially secured or unsecured and may be unrated, and whether or not rated, may have speculative characteristics. The market price of the Fund’s fixed income investments will change in response to changes in interest rates and other factors.
Generally, when interest rates go up, the value of fixed income instruments, such as bonds, typically go down (and vice versa) and investors may lose principal value. Credit risk is the risk of loss of principle due to the issuer’s failure to repay a loan. Generally, the lower the quality rating of an instrument, the greater the risk that the issuer will fail to pay interest fully and return principal in a timely manner. If an issuer defaults, the security may lose some or all its value. Lower rated bonds, convertible securities and other types of debt obligations involve greater risks than higher rated bonds.
Mortgage-related and asset-backed securities are subject to prepayment risk, can be highly sensitive to changes in interest rates, and are subject to credit risk/risk of default on the underlying assets… Convertible securities are generally not investment grade and are subject to greater credit risk than higher‐rated investments. High yield securities can be volatile and subject to much higher instances of default. The Fund may experience increased costs, losses and delays in liquidating underlying securities should the seller of a repurchase agreement declare bankruptcy or default.
The ratings agencies that provide ratings are Standard and Poor’s (“S&P”), Fitch, Moody’s, Kroll, DBRS, and any other nationally recognized statistical rating organization (“NRSRO”). Credit ratings range from AAA (highest) to D (lowest). Bonds rated BBB or above are considered investment grade (IG). Credit ratings of BB and below are lower-rated securities (junk bonds). High-yielding, non-investment grade bonds (junk bonds) (HY) involve higher risks than investment grade bonds. Bonds with credit ratings of CCC or below have high default risk.
Private placement securities are securities that are not registered under the federal securities laws and are generally eligible for sale only to certain eligible investors. Private placements may be illiquid, and thus more difficult to sell, because there may be relatively few potential purchasers for such investments, and the sale of such investments may also be restricted under securities laws.
The Fund may use leverage. While the use of leverage may help increase the distribution and return potential of the Fund, it also increases the volatility of the Fund’s net asset value (NAV), and potentially increases volatility of its distributions and market price. There are costs associated with the use of leverage, including ongoing dividend and/or interest expenses. There also may be expenses for issuing or administering leverage. Leverage changes the Fund’s capital structure through the issuance of preferred shares and/or debt, both of which are senior to the common shares in priority of claims. If short-term interest rates rise, the cost of leverage will increase and likely will reduce returns earned by the Fund’s common stockholders.
Value style investing presents the risk that the holdings or securities may never reach their full market value because the market fails to recognize what the portfolio management team considers the true business value or because the portfolio management team has misjudged those values. In addition, value style investing may fall out of favor and underperform growth or other styles of investing during given periods.
Distribution Rate
Distributions may include the net income from dividends and interest earned by fund securities, net capital gains, or in certain cases it may include a return of capital. The Fund may also pay a special distribution at the end of a calendar year to comply with federal tax requirements. All mutual funds, including closed-end funds, periodically distribute profits they earn to investors. By law, if a fund has net gains from the sale of securities, or if it earns dividends and interest from securities, it must pass substantially all of those earnings to its shareholders or it will be subject to corporate income taxes and excise taxes. These taxes would, in effect, reduce investors’ total return. First Pacific Advisors, LP does not provide legal, accounting, or tax advice.
The Fund’s distribution rate may be affected by numerous factors, including changes in realized and projected market returns, Fund performance, and other factors. There can be no assurance that a change in market conditions or other factors will not result in a change in the Fund’s distribution rate at a future time.
Index Definitions
Comparison to any index is for illustrative purposes only and should not be relied upon as a fully accurate measure of comparison. The Fund may be less diversified than the indices noted herein and may hold non-index securities or securities that are not comparable to those contained in an index. Indices will hold positions that are not within the Fund’s investment strategy. Indices are unmanaged and do not reflect any commissions, transaction costs, or fees and expenses which would be incurred by an investor purchasing the underlying securities and which would reduce the performance in an actual account. You cannot invest directly in an index. The Fund does not include outperformance of any index in its investment objectives.
S&P 500 Index includes a representative sample of 500 hundred companies in leading industries of the U.S. economy. The Index focuses on the large-cap segment of the market, with over 80% coverage of U.S. equities, but is also considered a proxy for the total market.
MSCI ACWI NR USD Index (MSCI ACWI) is an unmanaged free float-adjusted market capitalization weighted index that is designed to measure the equity market performance of developed and emerging markets. Net Return (NR) indicates that withholding taxes are applied to dividend reinvestments. MSCI uses withholding tax rates applicable to Luxembourg holding companies.
Bloomberg U.S. Aggregate Bond Index provides a measure of the performance of the US investment grade bonds market, which includes investment grade US Government bonds, investment grade corporate bonds, mortgage pass-through securities and asset-backed securities that are publicly offered for sale in the United States. The securities in the Index must have at least 1-year remaining in maturity. In addition, the securities must be denominated in US dollars and must be fixed rate, nonconvertible, and taxable.
Consumer Price Index (CPI) is an unmanaged index representing the rate of the inflation of U.S. consumer prices as determined by the U.S. Department of Labor Statistics. The CPI is presented to illustrate the Fund’s purchasing power against changes in the prices of goods as opposed to a benchmark, which is used to compare the Fund’s performance. There can be no guarantee that the CPI will reflect the exact level of inflation at any given time.
60% S&P500 / 40% BBG U.S. Aggregate Bond Index is a hypothetical combination of unmanaged indices and comprises 60% S&P 500 Index and 40% Bloomberg U.S. Aggregate Bond Index.
60% MSCI ACWI / 40% BBG U.S. Aggregate Bond Index is a hypothetical combination of unmanaged indices and comprises 60% MSCI ACWI Index and 40% Bloomberg U.S. Aggregate Bond Index.
Bloomberg U.S. High Yield Index measures the market of USD-denominated, non-investment grade, fixed-rate, taxable corporate bonds.
Bloomberg U.S. High Yield BB ex Energy Index measures the market of USD-denominated, non-investment grade, fixed-rate, taxable BB-rated corporate bonds excluding energy sector.
Glossary of Terms
Discount to Net Asset Value (NAV) is a pricing situation when a closed-end fund’s market trading price is lower than its daily net asset value (NAV).
Dividend Yield is the dividend per share divided by the price per share.
High Yield (HY) bond is a high paying bond with a lower credit rating (S&P and Fitch, BB+ and lower; Moody’s, Ba1 or lower) than investment-grade corporate bonds, Treasury bonds and municipal bonds. Because of the higher risk of default, these bonds pay a higher yield than investment grade bonds.
Investment Grade (IG) is a rating (S&P and Fitch, BBB- and higher; Moody’s Baa3 and higher) that indicates that a bond has a relatively low risk of default.
Market Capitalization refers to the total dollar market value of a company’s outstanding shares of stock.
Net Asset Value (NAV) represents the net value of a mutual fund and is calculated as the total value of the fund’s assets minus the total value of its liabilities and is shown as a per share price.
Standard Deviation is a measure of the dispersion of a set of data from its mean.
Volatility is a statistical measure of the dispersion of returns for a given security or market index. In most cases, the higher the volatility, the riskier the security. Volatility is often measured as either the standard deviation or variance between returns from that same security or market index.
Spread reflects the quoted spread of a bond that is relative to the security off which it is priced, typically an on the-run treasury.
Yield is the discount rate that links the bond’s cash flows to its current dollar price.
Yield to Worst (YTW) is a measure of the lowest possible yield that can be received on a bond that fully operates within the terms of its contract without defaulting. It is a type of yield that is referenced when a bond has provisions that would allow the issuer to close it out before it matures.
©2025 Morningstar, Inc. All Rights Reserved. The information contained herein: (1) is proprietary to Morningstar and/or its content providers; (2) may not be copied or distributed; and (3) is not warranted by Morningstar to be accurate, complete, or timely. Neither Morningstar nor its content providers are responsible for any damages or losses arising from any use of this information. Past performance is no guarantee, nor is it indicative, of future results.