
You should consider the Fund’s invehttps://fpa.com/wp-content/uploads/FPA-Queens-Road-Value-Fund-Commentary-2025-09.pdfstment objectives, risks, and charges and expenses carefully before you invest. The Prospectus details the Fund’s objective and policies and other matters of interest to a prospective investor. Please read the Prospectus carefully before investing. The Prospectus may be obtained by visiting the website at fpa.com, by calling toll-free, 1-800-982-4372, or by contacting the Fund in writing.
Average Annual Total Returns (%)
| As of December 31, 2025 | Since Inception | 20 Yr | 15 Yr | 10 Yr | 5 Yr | 3 Yr | 1 Yr | YTD | QTD |
|---|---|---|---|---|---|---|---|---|---|
| FPA Queens Road Small Cap Value (QRSVX) | 9.63 | 8.27 | 8.84 | 9.88 | 10.26 | 13.35 | 13.36 | 13.36 | -0.36 |
| Russell 2000 Value | 8.37 | 7.40 | 8.73 | 9.27 | 8.88 | 11.73 | 12.59 | 12.59 | 3.26 |
Index data source: Morningstar.
Past performance is no guarantee, nor is it indicative, of future results. Current performance may be higher or lower than the performance shown. This data represents past performance and investors should understand that investment returns and principal values fluctuate, so that when you redeem your investment it may be worth more or less than its original cost. Current month-end performance data, which may be lower or higher than the performance data quoted, may be obtained at fpa.com or by calling toll-free, 1-800-982-4372. The Fund’s Total Annual Operating Expenses are 0.94% (Investor Class), 0.88% (Advisor Class), and 0.80% (Institutional Class).
The FPA Queens Road Small Cap Value Fund (“Fund”) commenced operations on June 13, 2002 (Inception date). Fund performance shown is for the Investor Class shares (QRSVX). Periods greater than one year are annualized. Fund performance is shown net of all fees and expenses and includes reinvestment of all distributions. Fund performance does not reflect the deduction of taxes that a shareholder would pay on Fund distributions or the redemption of Fund shares, which would lower these figures. An investor cannot invest directly in an index.
Prior to November 1, 2020, the performance shown reflects the historical performance of the Fund when Bragg Financial Advisors, Inc. (“BFA”) served as investment adviser of the Fund.
From inception of the Fund to December 31, 2004, BFA and its affiliates voluntarily absorbed certain expenses of the Fund and voluntarily waived its management fee. Had BFA not done this, returns would have been lower during that period. Effective January 1, 2005 through October 31, 2020, BFA charged a single unitary management fee and contractually agreed to pay all operating expenses of the Fund except for brokerage, taxes, interest, litigation expenses, and other extraordinary expenses. Prior to November 1, 2020, the Fund had a unitized fee structure that limited annual operating expenses to 1.18%.
Please see additional important disclosures at the end of this Commentary.
Dear Fellow Shareholders
The FPA Queens Road Small-Cap Value Fund (“Fund”) returned -0.36% in the fourth quarter of 2025 vs. 3.26% for the Russell 2000 Value Index (“R2KV”). For calendar 2025, the Fund has returned 13.36% vs. 12.59% for the R2KV. As a reminder, we expect to outperform in down markets and trail in speculative markets as a result of our diligent, disciplined, and patient process.
20% or Larger Russell 2000 Value Drawdowns Since Fund Inception (%)1
| Jun-02 to Oct-02 | Jun-07 to Mar-09 | Jun-15 to Feb-16 | Aug-18 to Mar-20 | Nov-21 to Oct-23 | Nov-24 to Apr-25 | Average | |
|---|---|---|---|---|---|---|---|
| FPA Queens Road Small Cap Value | -16.70 | -50.69 | -10.17 | -26.74 | -12.08 | -18.79 | – |
| Russell 2000 Value | -28.99 | -61.71 | -22.55 | -46.03 | -26.60 | -26.57 | – |
| Downside capture ratio | 57.6 | 82.1 | 45.1 | 58.1 | 47.2 | 70.7 | 60.1 |
| Outperformance | 12.29 | 11.02 | 12.38 | 19.30 | 13.52 | 7.78 | 12.71 |
As we discussed in our third quarter letter, we outperformed during the first half 2025 when markets were weak and tariff-induced volatility allowed us to put cash to work at attractive prices. We trailed during third and fourth quarters in a market that favored speculation and momentum. This is consistent with our expectations and we are pleased with our performance.
For the year as a whole, several indicators show that lower quality stocks outperformed. The Russell 2000, in which roughly 40% of stocks are unprofitable, returned 12.81% while the S&P 600, which has a profitability requirement, returned 6.02% (The S&P600 also favors larger companies than the Russell 2000).2
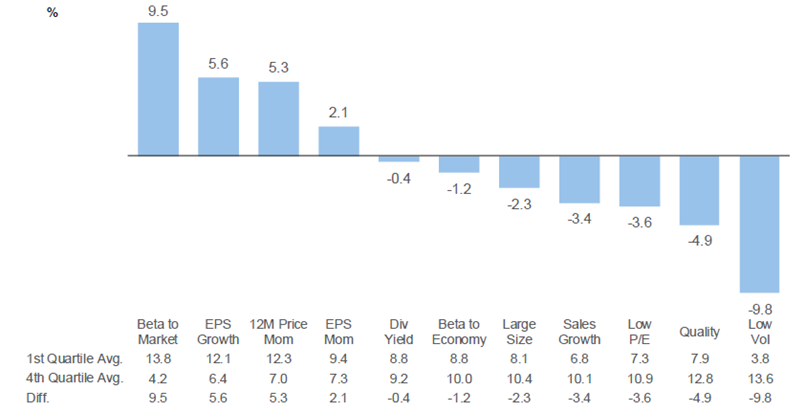
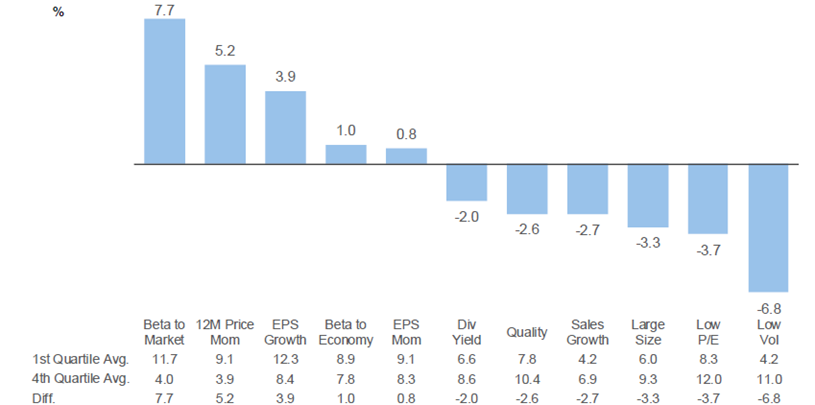
Below is the 2025 small blend and small value factor performance as compiled by Seaport Research Partners. Beta, momentum and EPS growth outperformed while quality, low volatility and value under performed.
Small Blend Manager Factor & Sector Performance3
2025 Factor Performance 1st Quartile vs. 4th Quartile Small Blend Sector
Small Value Manager Factor & Sector Performance3
2025 Factor Performance 1st Quartile vs. 4th Quartile Small Value Sector
1 As of December 31, 2025. Source: Morningstar Direct, FPA. Data shown for the FPA Queens Road Small Cap Value Fund – Investor Class (“Fund”). Inception of the Fund was June 13, 2002. The periods referenced above reflect Russell 2000 Value drawdowns 20% or greater and are calculated from that index’s peak and trough dates, (i.e., 6/28/2002-10/9/2002, 6/4/2007-3/9/2009, 6/23/2015-2/11/2016, 8/22/2018-3/23/2020, 11/8/2021-10/27/2023, 11/25/2024-4/8/2025). Please see page 1 for net performance of the Fund since inception. Please also see the end of this commentary for Important Disclosures and Definitions of Key Terms.
2 Source: Factset, Torston Slok at Apollo Academy; https://www.apolloacademy.com/the-share-of-companies-with-negative-earnings/
3 Source: Bloomberg, Seaport Research Partners. For market commentary and discussion purposes only not related to or derived from Fund holdings.
Our process, which focuses on quality and value, leads to a portfolio designed to protect our clients during market drawdowns. This necessarily means that we expect to trail when markets are frothy. Although we believe the companies we own can outperform over the long term, timing the market is beyond us. We never know when our companies are going to experience bumps in the road or when Mr. Market is going to come around to our point of view.
Our process (and temperament) are conservative by nature. We tend to worry much more about what can go wrong than what can go right. But we build the portfolio from the bottom up, company by company, and don’t position the portfolio based on sentiment or macro prognostications. We will keep doing what we always do which is turning over rocks while continuing to make incremental improvements to our process.
As managers of and significant shareholders in the Fund, we thank you for your support.
Market Commentary
Small-caps are overlooked, disdained and cheap relative to large-caps. There is a reasonable argument that small cap indices contain more low quality companies and should trade at a discount to the large cap indices. But, as active, bottom up stock pickers, we see additional nuance. In our letters, we have been making three inter-related arguments.
1) Quality small, measured on a like for like basis, outperforms historically. The researchers at AQR re-examined the small size premium and showed that there are proportionately fewer quality companies in the small cap universe. But, when you control for quality (i.e. choosing companies of equivalent quality), small companies outperform large companies, consistently and by a lot.4
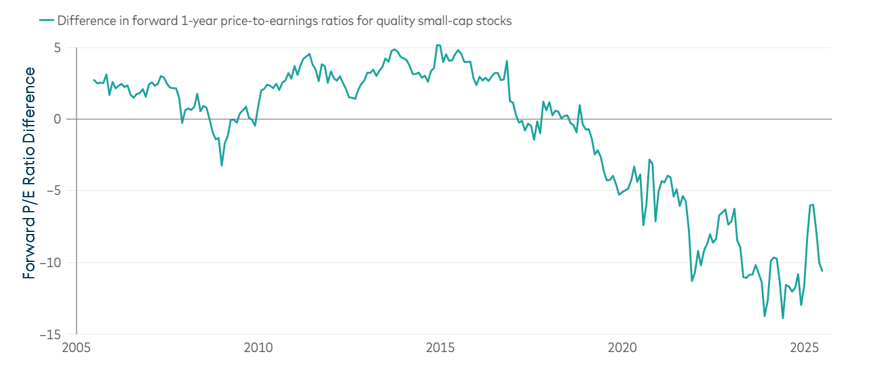
2) Quality small is relatively cheap right now. Vanguard compares the price-earnings multiples (P/Es) of high ROIC small caps to high ROIC large caps. Looking at forward P/Es, quality small caps are trading at a significant and growing discount to quality large caps, while, until 2016, they tended to trade at a premium.5
Quality Small-Caps have Become Cheap Compared with Large-Caps5
Similarly, we looked at consistent earners in our 2024 second quarter letter and found that small cap consistent earners were significantly cheaper than large cap consistent earners. And in our 2025 second quarter letter we found that the quality premium in small caps (as measured by our internal composite quality score) was modest. In contrast, the quality premium in large caps is pronounced.6
4 Source: https://www.aqr.com/Insights/Research/Working-Paper/Size-Matters-If-You-Control-Your-Junk
5 Source: Vanguard: https://corporate.vanguard.com/content/corporatesite/us/en/corp/vemo/fading-small-cap-premium-softer-us-labor-market.html. For market commentary and discussion purposes only not related to or derived from Fund holdings. Note: The difference in forward 1-year price-to-earnings ratios is calculated using the weighted harmonic average price-to-earnings ratio of quality small-cap stocks, based on consensus earnings per share estimates for the next fiscal year, minus the same metric for quality large-cap stocks. Quality stocks are defined as those with average returns on invested capital of more than 20% over the trailing three years. Small-cap stocks refers to those in the bottom third of the Russell 3000 Index by market weight and large-caps refers to those in the top third of the Russell 3000 Index by market weight
6 All FPA Queens Road Small Cap Fund letters can be found here: https://fpa.com/insights/?post-funds=qrsvx
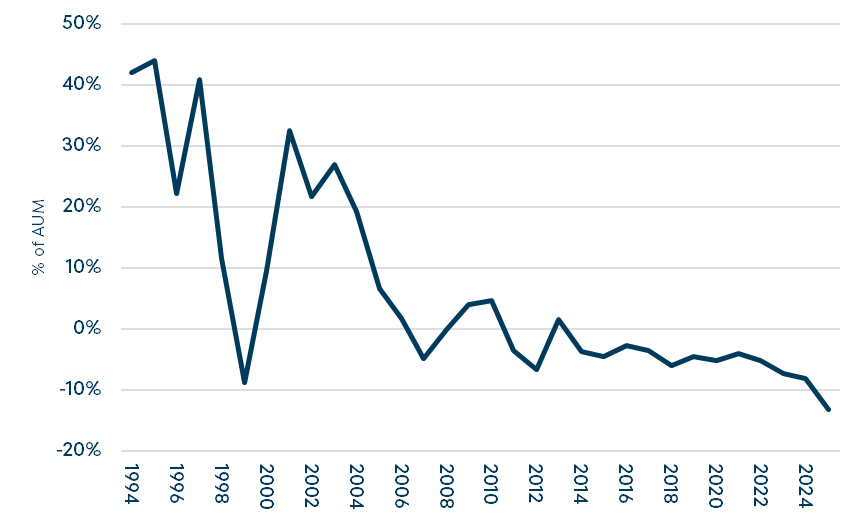
3) Small-caps have been disdained and overlooked – and this improves our opportunity set. Statistically defining our opportunity set is difficult. We deal in the particularities of individual companies which requires context, adjustment, and nuance. We know that outflows from actively managed small value have accelerated and reached -13% of assets under management in 2025. And while harder to measure, capital has also withdrawn from the single manager long short community that tended to look at small companies with a one to three year timeframe.7
Actively Managed Small Cap Value: Fund Flows as % of AUM8
Relatedly, we are currently looking to hire a junior analyst but care a lot that this person has the right temperament. The Fund has gotten fewer resume submissions than we expected. And the applicants we have seen tend to have an interest in tech stocks, growth stocks and crypto rather than quality, long-term, conservative investments. Sign of the times.
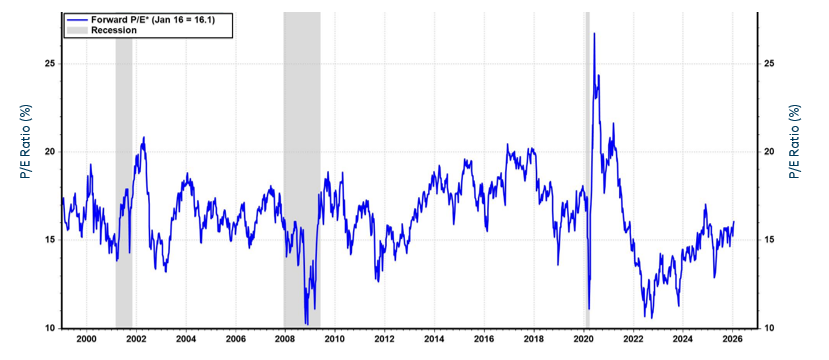
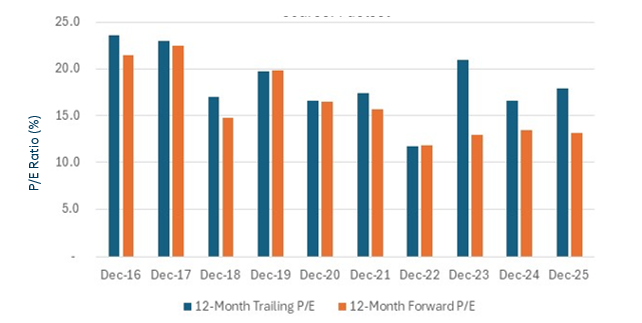
Small caps are relatively cheap. The mid teens P/E on the SP600 index and for our portfolio strike us as quite reasonable but not absolutely cheap.9 This compares to U.S. large caps which are trading at or near all-time high valuations.10
S&P 600: Forward P/E* (daily)11
Queens Road Small Cap Value Fund Portfolio Trailing and Forward P/Es12
7 As discussed by Adrian Meli of Eagle Capital on the Ted Seides Capital Allocators podcast (9/15/25); https://www.capitalallocators.com/podcast/adrian-meli-active-equity-excellence-at-eagle/
8 Source: Morningstar
9 SP600 historical P/Es from Yardeni; https://yardeni.com/charts/sp-600/. FPA Queens Road Value Fund historical P/Es from Factset.
10 JP Morgan; https://am.jpmorgan.com/us/en/asset-management/institutional/insights/market-insights/guide-to-the-markets/guide-to-the-markets-slides-us/equities/gtm-forwardpe/
11 Source: LSEG Datastream and © Yardeni Research, and Standard & Poor’s *Price divided by 12-month forward consensus expected operating earnings per share
12 Source: Factset
We often write about the small cap universe in general. But we spend the vast majority of our day to day looking at individual companies. And on the individual company level, we emphatically agree with the following quote from Howard Marks,
“In making investments, it has become my habit to worry less about the economic future – which I’m sure I can’t know much about – than I do about the supply/demand picture relating to capital. Being positioned to make investments in an uncrowded arena conveys vast advantages. Participating in a field that everyone’s throwing money at is a formula for disaster.” —Howard Marks (“You Can’t Predict. You Can Prepare.” — November 20, 2001)13
Below are three examples where, we believe, an uncrowded arena has created opportunity. All three are stocks that we have owned for a long time and that have performed well for the Fund. Their businesses haven’t changed much, but their valuations (market multiples) have come down with the ebbing small cap tide. The likely explanation is roughly: As small (and SMID) cap strategies see outflows, there isn’t another natural cohort of investors who want to buy high quality but boring small businesses at reasonable valuations. While no one was paying attention, earnings grew faster than the stock prices appreciated, pushing down their multiples and pushing up expected returns. We think all three are attractive opportunities at the current prices.
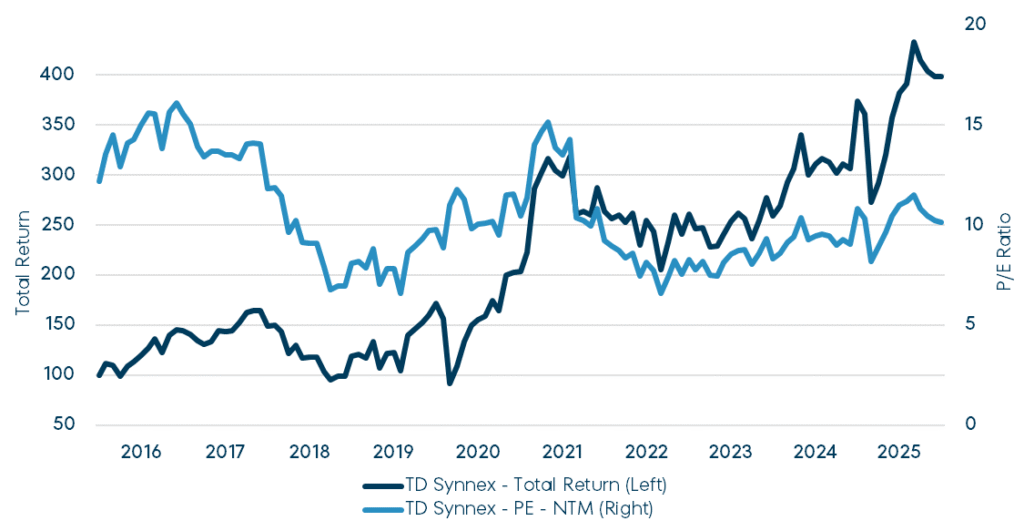
TD Synnex (SNX) is the world’s largest IT distributor.14 The company was formed by the merger of Tech Data and Synnex in 2021 – we first bought TD in 2010 (it was taken private in 2020) and SNX in 2012. 20 years ago, IT distribution meant delivering PCs, servers and networking equipment from warehouses to customers. But SNX used its position as a middleman to add value to both sides of the equation, acting as an outsourced sales force for its OEM suppliers while providing bundling, consultation and other value-added services to its customers. SNX evolved with the times selling increasing amounts of software, security, cloud and now AI products. Still, this is a relatively old school, low margin / high volume business with a large element of working capital management.
What is interesting to us is that SNX trades at roughly 10x forward earnings, towards the low end of its historical range (blue line on the chart below). The business continues to evolve but the basics are roughly the same as they were ten years ago. If anything, the business has gotten incrementally better – higher margins, higher returns on capital, more scale, consolidation among the large players and more international opportunity.15 After digesting Covid era excess spending, recent results have been strong. And the company has a long history of growth and strong returns for shareholders. But there’s no near term event or catalyst and our best guess is that SNX suffers from the limited constituency of long term owners in the SMID space. (SNX has a $12B market cap – the Fund is willing to hold stocks that successfully graduate out of small cap even if we only buy new holdings that are small.)
TD Synnex16
Past performance is no guarantee of future results. The information provided is for illustrative purposes only and does not constitute a recommendation to buy or sell any security. The position represents approximately 4.0% of the fund’s total portfolio weight.
13 From Oaktree Capital; https://www.oaktreecapital.com/docs/default-source/memos/2001-11-20-you-cant-predict-you-can-prepare.pdf
14 As of December 31, 2025: For their most recent fiscal years, TD Synnex had revenue of $62.5B while no. 2 Ingram Micro had revenue of $48.0B. Number 3 is Arrow Electronics’ ECS business with $7.9B in revenue. At the time of this commentary, TD Synnex most recently reported fiscal year ended September 2025. Ingram Micro and Arrow Electronics most recently reported fiscal year ended December 2024.
15 TD Synnex 10-Ks, presentations and earnings calls, FPA Queens Road Funds interpretation and adjustments; https://ir.tdsynnex.com/overview/default.aspx
16 Source: Factset
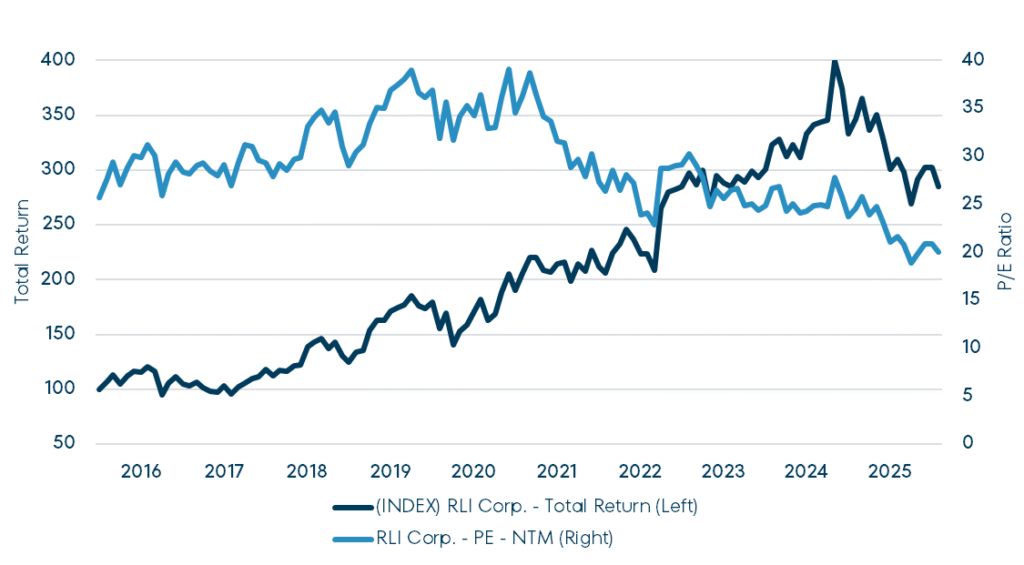
RLI is a specialty insurer with a diversity of niche lines including school busses, Hawaii homeowners and construction surety. The company has best in class financial metrics including consistent combined ratios under 90% and a return on equity (ROE) approaching 20%, despite being over capitalized.17 RLI has a unique risk culture that compensates everyone from underwriters to executives based on long-erm profitability net of adverse developments. Practically, this means that the company won’t commit capital or grow in unprofitable markets. RLI is probably the best managed insurer that we know and we first bought shares in 2011.
Because of its well-deserved reputation for quality, RLI has always traded at a premium valuation. But its trading multiples have come down over the last five years and RLI now trades for roughly 20x forward earnings (blue line below). Near term earnings growth will slow as the company pulls back in a soft market. But the company has experienced soft markets before, notably 2015 – 2017 when premiums grew at a 2.4% average rate and the company traded for ~30x earnings.
RLI Corp. (RLI)18
Past performance is no guarantee of future results. The information provided is for illustrative purposes only and does not constitute a recommendation to buy or sell any security. The position represents approximately 4.4% of the fund’s total portfolio weight.
New Jersey Resources (NJR) is a regulated gas utility serving Morris, Ocean and Monmouth counties in New Jersey. New Jersey has a favorable utility regulation environment – NJR gets a 9.6% allowed ROE and realizes practical cost reimbursement mechanisms that show up in the GAAP financials. The company has a culture of disciplined but ambitious capital allocation at the holding company level and has diversified into clean energy, FERC-regulated storage and pipelines and energy services and trading. NJR earns a mid-double digit ROE, strong for a utility holding company. All in, NJR has a history of high single digit EPS growth on top of its 50%+ dividend payout ratio.19
Incredibly, the Fund has owned shares in NJR since inception in 2002. And like SNX and RLI, the company has grown and evolved but hasn’t fundamentally changed over the last ten years. Yet its forward P/E multiple has declined from 20x to 15x (blue line below). We believe this is another case of an overlooked, “boring” stock and think shares in NJR are attractive.
New Jersey Resources (NJR)20
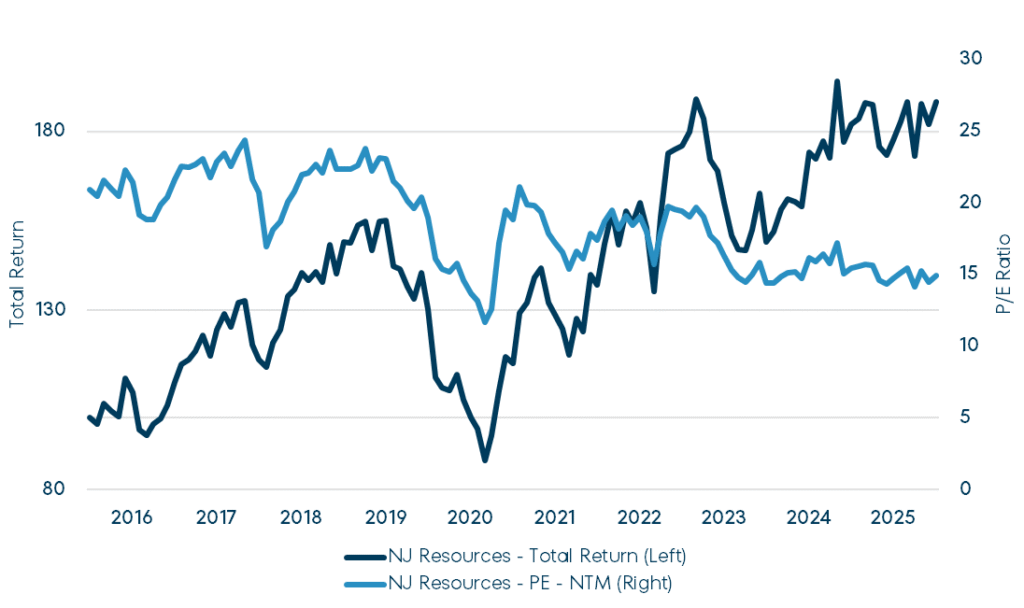
Past performance is no guarantee of future results. The information provided is for illustrative purposes only and does not constitute a recommendation to buy or sell any security. The position represents approximately 3.1% of the fund’s total portfolio weight.
We think that SNX, RLI and NJR are overlooked, out of favor and attractive. Given the lack of attention to quality small caps, the list of opportunities that are working their way through the upper stages of our funnel and making it onto our “work in progress” list is growing. Many look like the examples above – strong franchises in boring or out of favor industries whose valuation metrics have declined. These are our bread and butter.
But we are also seeing a large number of companies that have missed earnings or in some other way mis-stepped. We can’t say for sure, but it seems like the market’s punishment for earnings misses has only gotten worse. If the offending company also has some debt – then watch out below. In these situations, we tend to tread more carefully. We are generally wary of our ability to get an edge in complicated situations or battleground stocks. Still, there is a large group of small stocks that are real companies (not perpetual negative earners) with short-term concerns that are very, very cheap.
Everything we do is slow and deliberate. Working through companies takes time. And we deliberately push back against the behavioral bias towards wanting to take immediate action. We continue to stick to our philosophy and process and constantly seek new attractive investment opportunities for the Fund.
17 RLI 10-Ks, presentations and earnings calls, FPA Queens Road Funds interpretation and adjustments; https://investors.rlicorp.com/overview/default.aspx
18 Source: Factset
19 New Jersey Resources 10-Ks, presentations and earnings calls, FPA Queens Road Funds interpretation and adjustments; https://investor.njresources.com/home/default.aspx
20 Source: Factset
Portfolio Commentary
In Q4, we made incremental changes to re-balance the risk/reward in the portfolio. The Fund lagged its benchmark, the Russell 2000 Value Index (“R2KV”), which benefitted from an environment that favored momentum and speculation. We are opportunistically rebalancing the portfolio towards what we believe are higher quality holdings.
For us, the three most important elements of quality are balance sheet strength, earnings consistency, and returns on capital. Balance sheet strength helps a company overcome challenges and can protect in down markets. Long-term earnings consistency indicates that the company has a good business model in an attractive industry and is likely to remain profitable in the future. And high returns on capital suggests the company makes smart capital allocation decisions and uses its resources to produce economic value.
In Q4, we added a new position in ePlus (PLUS). ePlus is a value-added reseller (VAR) and consultant that helps businesses manage their IT spending. The company is well run in our opinion and scores highly on our quality dashboard. Adjusting for ePlus’ significant cash holdings, we think the company is inexpensive for its growth and quality profile.
We made significant additions to our holdings in Sprouts Farmers Market (SFM) and New Jersey Resources (NJR).21 Sprouts is a natural and organic grocery store chain that, in our opinion, has best-in-class operating metrics. SFM was a significant winner for the Fund in 2024 and 25H1 and we sold the majority of our position at higher prices. As growth decelerated in 25H2, SFM’s share price collapsed, giving us the opportunity to add to our remaining holdings at an attractive price. New Jersey Resources is a gas utility with additional investments in solar, midstream and services. We think the company is attractive at ~15x earnings.
We made a significant reduction to our position in Fabrinet (FN). Fabrinet is the leading manufacturer of optical networking equipment and subcomponents. The company has been a large beneficiary of the explosion in data center spending and performed extremely well in 2025. We continue to love the company but worry about an AI capex bubble and acknowledge that the stock has become expensive.
At quarter end, our cash position was 10.1%, unchanged from the end of Q3.
Trailing Twelve Months Top and Bottom Contributors (%)22
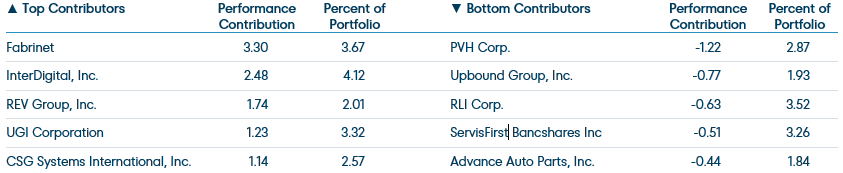
Top Contributors
- Fabrinet (FN) is a contract manufacturer specializing in optical networking equipment and modules. This is complex work at small scales, and Fabrinet dominates its niche. The company has experienced impressive historical revenue growth and growing operating margins. Fabrinet’s highest bandwidth products are finding increasing demand in data centers, especially those data centers used to train artificial intelligence models. In 2023, Fabrinet disclosed that Nvidia is a 10% customer. FN’s stock price has more than doubled since April on rising expectations for data center spending. We believe such spending, as capitalized in FN’s stock price, may have gotten ahead of itself and have been trimming. But the need for high bandwidth networking will continue, Fabrinet dominates its core telecom and data center markets and has prudently diversified into a handful of other niches that reward precise assembly at small scale. We believe Fabrinet will be a “compounder” for many years, and we continue to hold a position.
- InterDigital (IDCC) is a R&D organization that develops and acquires wireless communication and video patents. The company has a history of strong financial performance, opportunistically buys back shares, and pays a modest dividend. InterDigital has been successfully renewing its wireless licensing agreements (Apple in 2022, Samsung in 2023) and has a growing stream of recurring licensing revenues across consumer electronics, internet of things (IoT), and automotive customers. CEO Liren Chen joined the company in 2021 from Qualcomm and has been hiring other former Qualcomm managers. The company’s share price has increased over the past year due to growing revenue, profitability, and buybacks. We like the company’s long-term prospects but began trimming the Fund’s position this year on valuation.
- REV Group (REVG) is a specialty vehicle manufacturer. Most of the company’s value is in its municipal business where REV Group makes fire trucks and ambulances. The company has been reporting significant backlog and pricing growth in concert with Pierce Manufacturing (owned by Osh Kosh (OSK), another Fund holding), their primary competitor in the fire truck business. CEO Mark Skonieczny has led a significant operational restructuring, sold off the less profitable bus business, and used the proceeds to buy back stock at attractive prices. The stock price has followed improving results and performed well.
- UGI Corp (UGI) is a well-run gas and electric utility in Western Pennsylvania and West Virginia. The company also owns a sizable, regulated pipeline business, a large propane distribution business in Europe, and Amerigas, the U.S.’s largest propane distributor. UGI has been redirecting cash flow to pay down debt at Amerigas and the utility holding company. We are pleased with the company’s improved financial position, green shoots at Amerigas and the upgrade to UGI’s long term EPS growth rate announced during fiscal Q4 earnings.23
- CSG Systems (CSGS) makes software that manages customer relationships and billing for telecom companies. Under CEO Brian Shephard, the company has done an admirable job adding geographic and customer diversification. On October 29, NEC Corp, the parent of competitor Netcracker, announced that it was acquiring CSGS for $80.70 per share.24
Bottom Contributors
- PVH (PVH) is an apparel company that owns the Tommy Hilfiger and Calvin Klein brands globally. Most of PVH’s earnings come from Europe, where the Tommy and Calvin brands are considered “almost luxury” and where PVH has demonstrated high single-digit organic growth with pricing power over the decade preceding Covid. CEO Stefan Larsson has done an excellent job revitalizing the company and improving margins at PVH’s moribund U.S. operations. But, comparable revenue has been roughly flat over the last four quarters as the company bumped into weaker global consumer spending and actively cleaned up its channel inventory in Europe. Investors are skittish about tariffs and, in 2025, PVH’s inclusion on China’s “Unreliable Entity” list which threatens the roughly 15% of the company’s profitability that comes from China. But PVH’s sales and sourcing are globally diversified, and the company uses its prodigious cash flow to buy back shares. We think shares are cheap at roughly 6x trailing earnings.
- Upbound Group (UPBD) is a sub-prime lender that employs a rent-to-own model. The company has two primary segments: Rent-a-Center, which focuses on furniture and appliances through physical stores; and Acima, which offers last look financing through associated retailers including electronics and tire shops. Sub-prime consumers have struggled this year and Upbound’s operating results have ticked down. The company has been slow to de-lever after purchasing Acima in 2021 and made another incremental acquisition on Jan. 31, when it bought Brigit, an app which charges subscription fees to access payday lending. UPBD stock is cheap at less than five times forward earnings. But we have been slow to add given the company’s leverage and questions about its business model.
- RLI Corp (RLI) is a specialty property and casualty insurer. The company is extremely selective in writing business. Its diversified lines include niche-y areas such as public and school busses, Hawaii homeowners, and surety. RLI’s unique culture, incentive structures and willingness to walk away from unprofitable business have historically led to exceptional financial performance. From 2015 through 2024, the company’s combined ratio has averaged 89.3% and its ROE has averaged 16.6% despite being weighed down by excess capital.25 We have owned RLI since 2011 and the stock usually commands a premium valuation – we are pleased to be able to add to our position at roughly 20x this year’s earnings.
- ServisFirst Bancshares (SFBS) is a conservatively run lending franchise helmed by Tom Broughton. Tom hires local bankers but doesn’t build branches – this allows for best-in-class efficiency metrics while maintaining a strong and conservative lending culture. Return on equity (ROE) and average earnings per share growth were near 20% for the 10 years through 2024 – very attractive for a conservative, plain vanilla commercial lender.26 We think that SFBS trailed the regional bank indices in 2025 because of its concentrated exposure to South-Eastern real estate, a large Q3 non-accrual for which the bank obtained additional collateral and disappointing Q3 loan growth.27 We have followed the company for years and are extremely comfortable continuing to hold SFBS in our top 10 holdings.
- Advance Auto Parts (AAP) is an auto parts distributor that sells to both professional repair technicians and retail customers. The company is struggling through a difficult turnaround and sits firmly in our “opportunistic value” bucket. But the balance sheet is in good shape, new management has articulated a credible restructuring plan and the company’s mid-term guidance for 7% operating margins is reasonable compared to competitors and Advance Auto’s own history. Results have been inconsistent as management works through the restructuring of Advance Auto’s distribution, inventory, merchandising and store operations.
Conclusion
While we can’t control short-term performance, we will continue to manage our portfolio with diligence, discipline, and patience. We never make predictions about market direction, but we feel good about the Fund’s long-term prospects. And we are particularly pleased when we perform as expected, with limited downside capture.
As always, and as significant co-investors in the Fund, we appreciate your trust in us to be good stewards of your capital. If you would like to discuss performance or the Fund’s portfolio holdings in greater detail, please let us know.
Respectfully,
Steve Scruggs, CFA, Portfolio Manager
Ben Mellman, Portfolio Manager
December 31, 2025
21 We define a significant addition as increasing our holdings by 33% or more in positions where we have a portfolio weight of at least 1% at the previous quarter end
22 Reflects the top contributors and top detractors to the Fund’s performance based on preliminary contribution to return for the trailing twelve months (TTM) period ending December 31, 2025. Contribution is presented gross of investment management fees, transactions costs, and Fund operating expenses, which if included, would reduce the returns presented. Portfolio weights represent the average weights over the periods noted. A copy of the methodology used and a list of every holding’s contribution to the overall Fund’s performance during the quarter to date (QTD) and year to date (YTD) is available by contacting [email protected]. It should not be assumed that recommendations made in the future will be profitable or will equal the performance of the securities listed. Totals may not sum due to rounding. Note: December 31, 2025 company descriptions were developed by the investment team and unless otherwise noted reflect the most recent data made available by the companies or third-party research firms the investment team believe to be reliable.
23 UGI Fiscal Q4 earnings; source: https://ugi.gcs-web.com/news-releases/news-release-details/ugi-reports-strong-fiscal-2025-results
24 Source: https://www.bloomberg.com/news/articles/2025-10-29/nec-to-buy-us-telecom-services-provider-csg-for-2-9-billion
25 Source: RLI 10-Ks, presentations and earnings calls, FPA Queens Road Funds interpretation and adjustments; https://investors.rlicorp.com/overview/default.aspx
26 Source: Factset. Cumulative average growth rate is based on diluted earnings per share for year ends 2015-2024.
27 Source: ServisFirst Q3 2025 earnings; https://www.servisfirstbancshares.com/news-events/events-presentations
Important Information
This Commentary is for informational and discussion purposes only and does not constitute, and should not be construed as, an offer or solicitation for the purchase or sale of any securities, products or services discussed, and neither does it provide investment advice. Any such offer or solicitation shall only be made pursuant to the Fund’s Prospectus, which supersedes the information contained herein in its entirety. This Commentary does not constitute an investment management agreement or offering circular.
The statements contained herein reflect the opinions and views of the portfolio managers as of the date written, is subject to change without notice, and may be forward-looking and/or based on current expectations, projections, and/or information currently available. Such information may not be accurate over the long-term. These views may differ from other portfolio managers and analysts of the firm as a whole and are not intended to be a forecast of future events, a guarantee of future results or investment advice.
Portfolio composition will change due to ongoing management of the Fund. References to individual securities or sectors are for informational purposes only and should not be construed as recommendations by the Fund, the portfolio manager, the Adviser, the Sub-Adviser or the distributor. It should not be assumed that future investments will be profitable or will equal the performance of the security or sector examples discussed. The portfolio holdings as of the most recent quarter-end may be obtained at fpa.com.
Future events or results may vary significantly from those expressed and are subject to change at any time in response to changing circumstances and industry developments. The information and data contained herein has been prepared from sources believed reliable, but the accuracy and completeness of the information cannot be guaranteed and is not a complete summary or statement of all available data
The information contained herein is not complete, may change, and is subject to, and is qualified in its entirety by, the more complete disclosures, risk factors, and other information contained in the Fund’s Prospectus and Statement of Additional Information. The information is furnished as of the date shown. No representation is made with respect to its completeness or timeliness. The information is not intended to be, nor shall it be construed as, investment advice or a recommendation of any kind.
Certain statements contained in this presentation may be forward-looking and/or based on current expectations, projections, and information currently available. Actual events or results may differ from materially those we anticipate, or the actual performance of any investments described herein may differ from those reflected or contemplated in such forward-looking statements, due to various risks and uncertainties. We cannot assure future results and disclaim any obligation to update or alter any forward-looking statements, whether as a result of new information, future events, or otherwise. Such statements may or may not be accurate over the long-term. Statistical data or references thereto were taken from sources which we deem to be reliable, but their accuracy cannot be guaranteed.
The reader is advised that the Fund’s investment strategy includes active management with corresponding changes in allocations from one period of time to the next. Therefore, any data with respect to investment allocations as of a given date is of limited use and may not be reflective of the portfolio manager’s more general views with respect to proper geographic, instrument and /or sector allocations. The data is presented for indicative purposes only and, as a result, may not be relied upon for any purposes whatsoever.
In making any investment decision, you must rely on your own examination of the Fund, including the risks involved in an investment. Investments mentioned herein may not be suitable for all recipients and in each case, potential investors are advised not to make any investment decision unless they have taken independent advice from an appropriately authorized advisor. An investment in any security mentioned herein does not guarantee a positive return as securities are subject to market risks, including the potential loss of principal. You should not construe the contents of this document as legal, tax, investment or other advice or recommendations.
Fund performance presented is calculated on a total return basis, which includes the reinvestment of all income, plus realized and unrealized gains/losses, if applicable. Unless otherwise indicated, performance results are presented on a net of fees basis and reflect the deduction of, among other things: management fees, brokerage commissions, operating and administrative expenses, and accrued performance fee/allocation, if applicable.
The information provided in this presentation is based upon data existing as of the date(s) of the report and has not been audited or reviewed. While we believe the information to be accurate, it is subject in all respects to adjustments that may be made after proper review and reconciliation.
Investments carry risks and investors may lose principal value. Capital markets are volatile and can decline significantly in response to adverse issuer, political, regulatory, market, or economic developments. Securities of smaller, less well-known companies involve greater risks and they can fluctuate in price more than larger company securities. You risk paying more for a security than you received from its sale.
The Fund primarily invests in equity securities (common stocks, preferred stocks and convertible securities) of small-capitalization U.S. companies, defined as those with market-capitalization, at the time of purchase, that is no greater than the largest market-capitalization of any company included in the Russell 2000 Index. Investing in small companies involves special risks including, but not limited to, the following: smaller companies typically have more risk and their company stock prices are more volatile than that of large companies; their securities may be less liquid and may be thinly traded which makes it more difficult to dispose of them at prevailing market prices; these companies may be more adversely affected by poor economic or market conditions; they may have limited product lines, limited access to financial resources, and may be dependent on a limited management group; and small-cap stocks may fluctuate independently of large-cap stocks. All investment decisions are made at the discretion of the Portfolio Manager, in accordance with the then current Prospectus. Comparison to any index is for illustrative purposes only.
The prices of securities held by the Fund may decline in response to certain events taking place around the world, including those directly involving the companies whose securities are owned by the Fund. Securities in the Fund’s portfolio may underperform due to inflation (or expectations for inflation), interest rates, global demand for particular products or resources, natural disasters, pandemics, epidemics, terrorism, regulatory events and governmental or quasi-governmental actions. There is a risk that you may lose money by investing in the Fund.
Value style investing presents the risk that the holdings or securities may never reach their full market value because the market fails to recognize what the portfolio management team considers the true business value or because the portfolio management team has misjudged those values. In addition, value style investing may fall out of favor and underperform growth or other styles of investing during given periods.
Please refer to the Fund’s Prospectus for a complete overview of the primary risks associated with the Fund.
©2026 Morningstar, Inc. All Rights Reserved. The Morningstar information contained herein: (1) is proprietary to Morningstar and/or its content providers; (2) may not be copied or distributed; and (3) is not warranted by Morningstar to be accurate, complete, or timely. Neither Morningstar nor its content providers are responsible for any damages or losses arising from any use of this information. Past performance is no guarantee of future results.
The FPA Funds are distributed by Distribution Services, LLC. 190 Middle Street, Suite 301, Portland, ME 04101. Distribution Services, LLC and FPA are not affiliated.
Index Definitions
The Fund will typically be less diversified than the indices noted herein and may hold non-index securities or securities that are not comparable to those contained in an index. Indices will hold positions that are not within the Fund’s investment strategy. Indices are unmanaged and do not reflect any commissions, transaction costs, or fees and expenses which would be incurred by an investor purchasing the underlying securities and which would reduce the performance in an actual account. You cannot invest directly in an index.
The Russell 2000 Index measures the performance of the small-cap segment of the U.S. equity universe. It is a market cap weighted index that includes the smallest 2,000 companies covered in the Russell 3000 universe of United States-based listed equities.
The Russell 2000 Value Index measures the performance of the small-cap value segment of the U.S. equity universe. It includes those Russell 2000 companies that are considered more value oriented relative to the overall market as defined by Russell’s leading style methodology.
Standard & Poor’s 500 Stock Index (S&P 500) is a-capitalization-weighted index which covers industrial, utility, transportation and financial service companies, and represents approximately 75% of the New York Stock Exchange (NYSE) capitalization and 30% of NYSE issues. The S&P 500 is considered a measure of large-capitalization stock performance.
Standard & Poor’s 600 Stock Index (S&P 600) is an index of small-cap stocks managed by Standard & Poor’s. It tracks a broad range of small-sized companies that meet specific liquidity and stability requirements. This is determined by specific metrics such as public float, market capitalization, and financial viability, among other factors.
Small-cap Value Companies: The term small-cap describes companies with a relatively small market-capitalization. A company’s market-capitalization is the market value of its outstanding shares. The definition for small-cap varies, but generally means a company with $300 million to $2 billion in market-capitalization.
Glossary of Terms
Downside-capture ratio is used to evaluate how well an investment manager performed relative to an index during periods when that index has fallen. The ratio is calculated by dividing the manager’s returns by the returns of the index during the down market, and multiplying that factor by 100. BPS or basis points; 1 bps is equal to 0.01%.
Earnings per share (EPS) is calculated as a company’s profit divided by the outstanding shares of its common stock.
Expected earnings are an estimate for a company’s future quarterly or annual earnings per share (EPS).
Forward earnings are an estimate of the next period’s earnings of a company, usually through the completion of the current fiscal year and sometimes to the following fiscal year.
Free Cash Flow represents the cash a company can generate after required investment to maintain or expand its asset base.
Margin of Safety – Buying with a “margin of safety” is when a security is purchased at a discount to the portfolio manager’s estimate of its intrinsic value. Buying a security with a margin of safety is designed to protect against permanent capital loss in the case of an unexpected event or analytical mistake. A purchase made with a margin of safety does not guarantee the security will not decline in price.
Market Cycle Performance is defined as a period that contains a decline of at least 20% from the previous market peak over at least a two-month period and a rebound to establish a new peak above the prior market peak.
Price/Earnings Ratio (P/E) is the price of a stock divided by its earnings per share. Percentages are based on the absolute number of shares. P/E ex-Neg EPS is Price/Earnings ex negative earnings per share. P/E, average P/E, or P/E (trailing) is based on the last 12 months of actual earnings. P/E, next 12 months or P/E (forward) utilizes forward earnings expectations over the next 12 months to calculate the ratio.
Return on Equity (ROE) measures a corporation’s profitability by revealing how much profit a company generates with the money shareholders have invested.