
You should consider the Fund’s investment objectives, risks, and charges and expenses carefully before you invest. The Prospectus details the Fund’s objective and policies and other matters of interest to a prospective investor. Please read the Prospectus carefully before investing. The Prospectus may be obtained by visiting the website at fpa.com, by calling toll-free, 1-800-982-4372, or by contacting the Fund in writing.
Trailing Performance (%)
| As of June 30, 2025 | Since Inception | 20 Yr | 15 Yr | 10 Yr | 5 Yr | 3 Yr | 1 Yr | YTD | QTD |
|---|---|---|---|---|---|---|---|---|---|
| FPA Queens Road Small Cap Value (QRSVX) | 9.52 | 7.91 | 9.80 | 8.88 | 14.26 | 12.98 | 16.50 | 5.87 | 8.60 |
| Russell 2000 Value | 7.85 | 6.80 | 9.35 | 6.72 | 12.47 | 7.45 | 5.54 | -3.16 | 4.97 |
Past performance is no guarantee, nor is it indicative, of future results. Current performance may be higher or lower than the performance shown. This data represents past performance and investors should understand that investment returns and principal values fluctuate, so that when you redeem your investment it may be worth more or less than its original cost. Current month-end performance data, which may be lower or higher than the performance data quoted, may be obtained at fpa.com or by calling toll-free, 1-800-982-4372. The Fund’s Total Annual Operating Expenses are 0.99% (Investor Class), 0.91% (Advisor Class), and 0.80% (Institutional Class).
The FPA Queens Road Small Cap Value Fund (“Fund”) commenced operations on June 13, 2002 (Inception date). Fund performance shown is for the Investor Class (QRSVX). Periods greater than one year are annualized. Fund performance is shown net of all fees and expenses and includes reinvestment of all distributions. Fund performance does not reflect the deduction of taxes that a shareholder would pay on Fund distributions or the redemption of Fund shares, which would lower these figures. An investor cannot invest directly in an index.
Prior to November 1, 2020, the performance shown reflects the historical performance of the Fund when Bragg Financial Advisors, Inc. (“BFA”) served as investment adviser of the Fund. F
rom inception of the Fund to December 31, 2004, BFA and its affiliates voluntarily absorbed certain expenses of the Fund and voluntarily waived its management fee. Had BFA not done this, returns would have been lower during that period. Effective January 1, 2005 through October 31, 2020, BFA charged a single unitary management fee and contractually agreed to pay all operating expenses of the Fund except for brokerage, taxes, interest, litigation expenses, and other extraordinary expenses.
Please see additional important disclosures at the end of this Commentary.
Dear Shareholder
The FPA Queens Road Small-cap Value Fund (“Fund”) returned 8.60% for the second quarter of 2025 compared to a 4.97% return for the Russell 2000 Value Index (“Index”) in the same period.
Year to date, the Fund returned 5.87% versus -3.16% for the Index.
We focus on long term performance. Our goal is to outperform the Russell 2000 Value Index with less risk over the full market cycle. As a result of our diligent, disciplined, and patient process, we expect to outperform in down markets, consistent with the Fund’s historical returns.
20%+ Russell 2000 Value Drawdowns Since Fund Inception1
| Jun-02 to Oct-02 | Jun-07 to Mar-09 | Jun-15 to Feb-16 | Aug-18 to Mar-20 | Nov-21 to Oct-23 | Average | |
|---|---|---|---|---|---|---|
| FPA Queens Road Small Cap Value | -16.70% | -50.69% | -10.17% | -26.74% | -12.08% | — |
| Russell 2000 Value | -28.99% | -61.71% | -22.55% | -46.03% | -25.60% | — |
| Downside capture ratio | 57.6% | 82.1% | 45.1% | 58.1% | 47.2% | 58.03% |
| Outperformance (bps) | 1229 | 1102 | 1238 | 1930 | 1352 | — |
Performance versus the Index was strong in the first half of 2025 and we are pleased with the results – particularly our ability to outperform when the markets were weak and volatile. But, despite the market volatility, the Fund’s short-term performance resulted from long-term investments, not trading activity. Turnover was low and mostly in service of portfolio maintenance. We added to portfolio holdings when we felt they offered an attractive risk-reward and trimmed positions that had performed well and had gotten too large. In the first half of 2025, we benefitted from holding a collection of what we view as quality companies at reasonable valuations for the long term.
The Fund’s first half (1H) performance was diversified and was not the result of concentrated sector, thematic or factor bets. For 1H 2025, the Fund’s top five contributors were Fabrinet (FN), Sprouts Farmers Market (SFM), REV Group (REVG), UGI Corporation (UGI) and InterDigital (IDCC) – two tech companies, one consumer staple, one industrial, and one utility. Furthermore, Fabrinet and Interdigital have very different business models – Fabrinet manufactures optical components while InterDigital develops and licenses wireless patents. The Fund’s only meaningful losses during 1H 2025 were in two apparel companies, PVH Corp (PVH) and G-III Apparel Group Ltd (GIII), whose stocks were weak in Q1 on consumer spending fears and then traded lower when Trump’s tariffs were announced in April. We believe both companies have strong economic prospects and are attractively valued.2
Tariff related market volatility in April provided an opportunity for us to put cash to work. In total, the Fund’s cash position fell from 10.3% at the beginning of the quarter to 7.4% at the end of the third week in April.3
1 As of June 30, 2025. Source: Morningstar Direct, FPA. Data shown for the FPA Queens Road Small Cap Value Fund – Investor Class (“Fund”). Inception of the Fund was June 13, 2002. The periods referenced above reflect Russell 2000 Value drawdowns 20% or greater and are calculated from that index’s peak and trough dates, (i.e., 6/28/2002-10/9/2002, 6/4/2007-3/9/2009, 6/23/2015- 2/11/2016, 8/22/2018-3/23/2020, 11/8/2021-10/27/2023). Please see page 1 for net performance of the Fund since inception. Please also see the end of this commentary for Important Disclosures and Definitions of Key Terms.
2 Please see page 9 for more information on 1H 2025 contribution to return. As of June 30, 2025, the portfolio weights for the holdings mentioned were: FN (4.3%), SFM (2.4%), REVG (2.7%), UGI (3.2%), IDCC (3.6%), PVH (2.7%), GIII (1.6%). The information provided does not reflect all positions purchased, sold or recommended by the portfolio manager during the 1H 2025. It should not be assumed that recommendations made in the future will be profitable or will equal the performance of the securities listed.
3 The Fund’s cash position of 7.4% is as of April 18, 2025.
Past performance is no guarantee, nor is it indicative, of future results.
We mostly bought shares in existing portfolio holdings that we think looked attractive with a three-to-five year view. At quarter end, the Fund’s cash position was 8.3% as inflows offset some of our investing activity.
We added two new positions to the Fund during the second quarter. Ingles Markets (IMKTA) is a Southeastern regional grocery chain with roughly 200 stores. The grocery operations are well run with a focus on community and customer loyalty in underserved rural markets. In addition, Ingles is asset-rich – they own most of their properties as well as almost five million sqft. of shopping centers leased to third parties. The company has little financial debt and trades at an attractive valuation.
Nelnet (NNI) is a financial conglomerate based in Lincoln, NE and chaired and controlled by Michael Dunlap. From its core business of holding a levered portfolio of federally guaranteed FFELP student loans, Nelnet has built sizable operations in loan servicing and education software and payments. Mr. Dunlap has built a culture that is entrepreneurial, opportunistic, and aligned, and Nelnet has successfully found ways to reinvest the earnings and runoff from its loan portfolio. Like Ingles, Nelnet is asset-rich and we think should compound book value at an attractive rate over the long term.
In Q2, we made significant additions to the Fund’s holdings in Littelfuse (LFUS), REV Group (REVG), Synaptics (SYNA), Darling Ingredients (DAR), and Concentrix (CNXC).4 Littelfuse and Synaptics are technology component manufacturers that became very discounted during the April tariff volatility. Rev Group was a new position in Q1 that we continued adding to. Darling and Concentrix are smaller holdings that we believe offer attractive risk / rewards.
The Fund received shares in Angi (ANGI) that were spun out of longtime holding IAC Corp (IAC) on April 1, 2025. We have decided to continue holding Angi shares although it is a very small position for the Fund.
There were no significant reductions to Fund’s holdings in the quarter.
Market Commentary
- While small caps overall are cheap compared to large caps on a price to earnings (P/E) basis, we believe that the real opportunity lies in quality small companies.
- High-quality small companies are trading at a very modest price premium compared to lower-quality small companies or the small cap average. This is different from what we see in large caps where the highest-quality companies command a significant price premium.
- For the Fund itself, the portfolio P/E ratio has trended modestly down over the last ten years. The Fund is currently cheap relative to its own history.5
Small caps are historically cheap versus large caps on trailing P/E. We believe the best opportunity lies in quality small caps—firms with strong balance sheets, consistent earnings, and high returns on capital. Our internal quality dashboard ranks the S&P 600 by these attributes and shows only a modest valuation premium for the highest-quality small caps, unlike the S&P 500 where quality commands a large premium. Combined with persistent outflows from actively managed small-cap value funds, we think selective, fundamentals-driven investors can find compelling ideas.
4 We define a significant addition as increasing our holdings by 33% or more in positions where we have a portfolio weight of at least 1% at quarter end. As of June 30, 2025, the weights for the holdings noted, including ANGI, were: IMKTA (1.0%), NNI (1.3%), LFUS (2.2%); REVG (2.7%), SYNA (2.0%), DAR (1.3%), CNXC (1.0%), ANGI (0.3%), IAC (1.6%). The information provided does not reflect all positions purchased, sold or recommended by the portfolio manager during Q2 2025. It should not be assumed that recommendations made in the future will be profitable or will equal the performance of the securities listed.
5 As of 12/31/2015, the Fund’s Trailing P/E was 18.7, and as of 12/31/2024, the Fund’s Trailing P/E was 16.6.
S&P 500 vs S&P 600 Trailing P/E Ratios
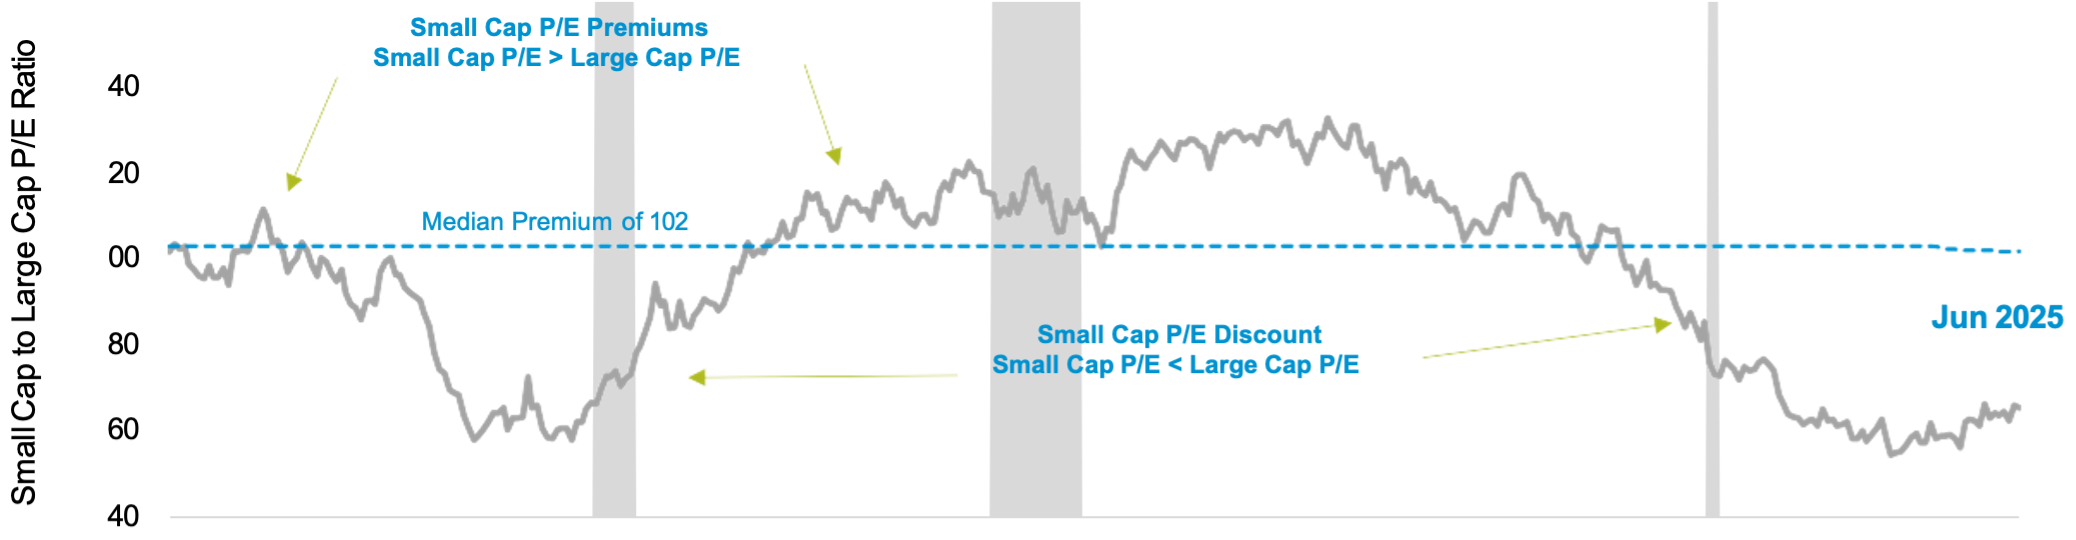
Source: Factset and FRED. Chart data from 1/1/1994 to 6/30/2025. Universe was segregated into large- and small-cap tiers. Grey vertical bars identify recessionary periods of April 2001 to November 2001, January 2008 to June 2009, March 2020 to April 2020. Price/Earnings Ratio (P/E). The S&P 600 index seeks to measure the small-cap segment of the US equity market. Small cap companies are typically defined as companies with a market capitalization of $1.2 billion to $8.0 billion.
Although small caps in general are cheap compared to large caps, we have been arguing that the real investing opportunity is in quality small companies. In our Q2 2024 letter, we looked at earnings consistency as an indicator of quality. When comparing small and large U.S. companies with similar earnings consistency, the smaller companies were decidedly cheaper.6 Similarly, we have been pointing investors towards the AQR essay “Size Matters, If You Control Your Junk.”7 In that piece of quantitative research, AQR finds that small companies outperform large companies, consistently and significantly, when controlling for quality.
Quality can be defined in many different ways. But, for us, the three most important elements of quality are balance sheet strength, earnings consistency, and returns on capital. Balance sheet strength helps a company overcome challenges and protects on the downside. Earnings consistency indicates that the company is likely to continue being profitable going forward. And high returns on capital suggest the company uses its resources to produce economic value.
To keep track of the quality companies in our universe, we built a custom dashboard that combines the metrics above (balance sheet strength, earnings consistency, and returns on capital) with earnings growth, current profitability, and length of operating history. The end result is an ordered quality score from zero to 100 for all North American small caps. The highest quality companies, by a combination of these statistical measures, have scores in the 80s and 90s. Companies that score badly rank near zero. And we assign a zero to companies that we disqualify because of negative earnings or too much debt. We use the top part of the dashboard as a place to fish for new ideas.8
How much more expensive, on a price-to-earnings (P/E) basis, are high-quality companies compared to low-quality companies? To make our assessment, we applied our quality score and methodology to the constituents of the S&P 600 small cap index and the S&P 500 large cap index. In the charts below, we show both indices bucketed into deciles by our “Queens Road Quality Score” as described above. The highest 10% of quality companies are in bucket 1, the next 10% – 20% of companies by quality in bucket two, etc., until the lowest 10% of companies on our internal quality scoring are in bucket 10. On the Y-axis, we show the average P/E for each decile. Consistent with the discussion above, small caps in general are cheaper than large caps based on our analysis (our quality scores are on an equal-weight basis).
What strikes us is that the results for the S&P 600 index are surprisingly “flat”. That is, the highest quality small companies command only a modest premium over both the average and lower-quality small companies. By comparison, the results for the S&P 500 are much more graduated – in large caps, investors pay a significant premium for quality.
6 FPA Queens Road Small Cap Fund Q2 2024 commentary; https://fpa.com/funds/fpa-queens-road-small-cap-value-fund-quarterly- commentary-archive
7 “Size Matters, If You Control Your Junk” by Cliff Asness, Andrea Frazzini, Roman Israel, Tobias Moskowitz and Lasse Pederson; September 2018; https://www.aqr.com/Insights/Research/Working-Paper/Size-Matters-If-You-Control-Your-Junk
8 All data for the custom dashboard is sourced from Factset. Analysis by BFA. Because this dashboard is a statistical measure and looks for quality, we exclude companies with negative or invalid forward earnings estimates or with fewer than five years of financial data or positive earnings. These companies are assigned a quality score of zero in our internal dashboard and are excluded from any analysis.
Average Forward P/E of S&P 600 (Small Cap) Companies by Decile Based on the Queens Road Quality Score
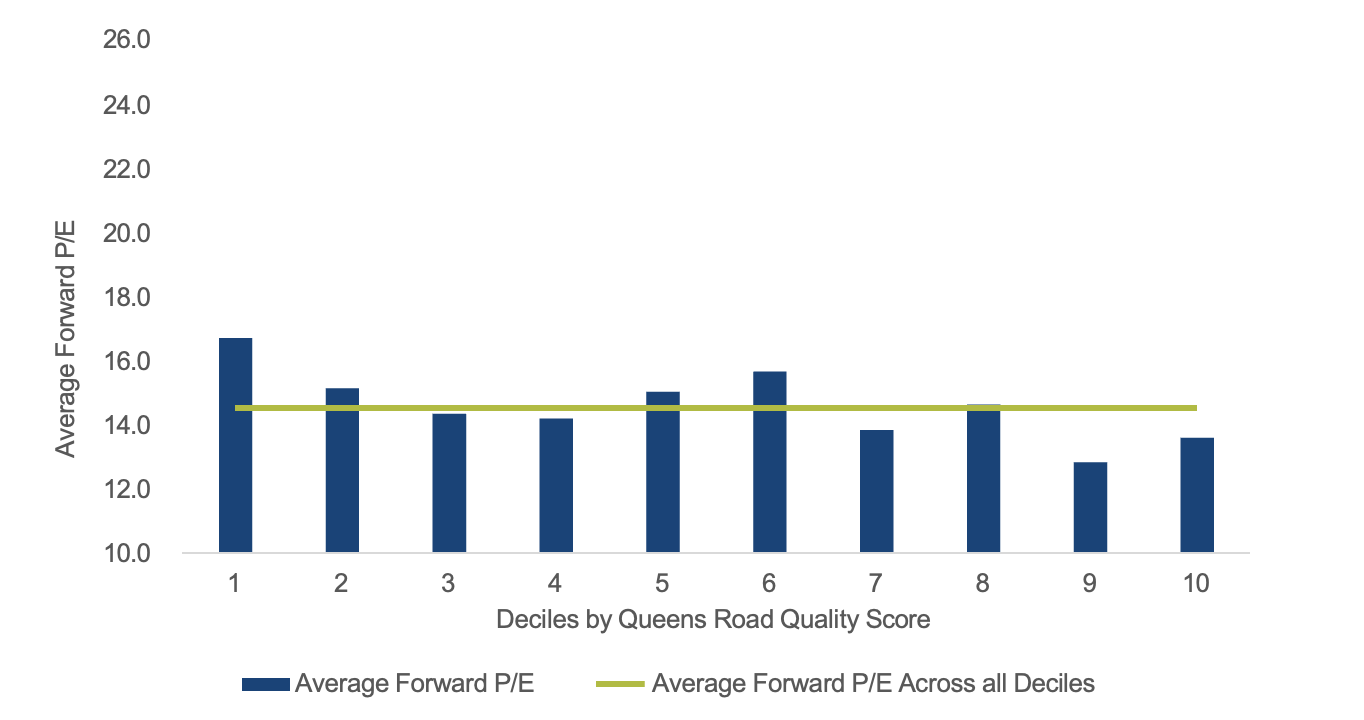
Source: Factset and Bragg Financial. As of June 30, 2025.
Average Forward P/E of S&P 500 (Large Cap) Companies by Decile Based on the Queens Road Quality Score
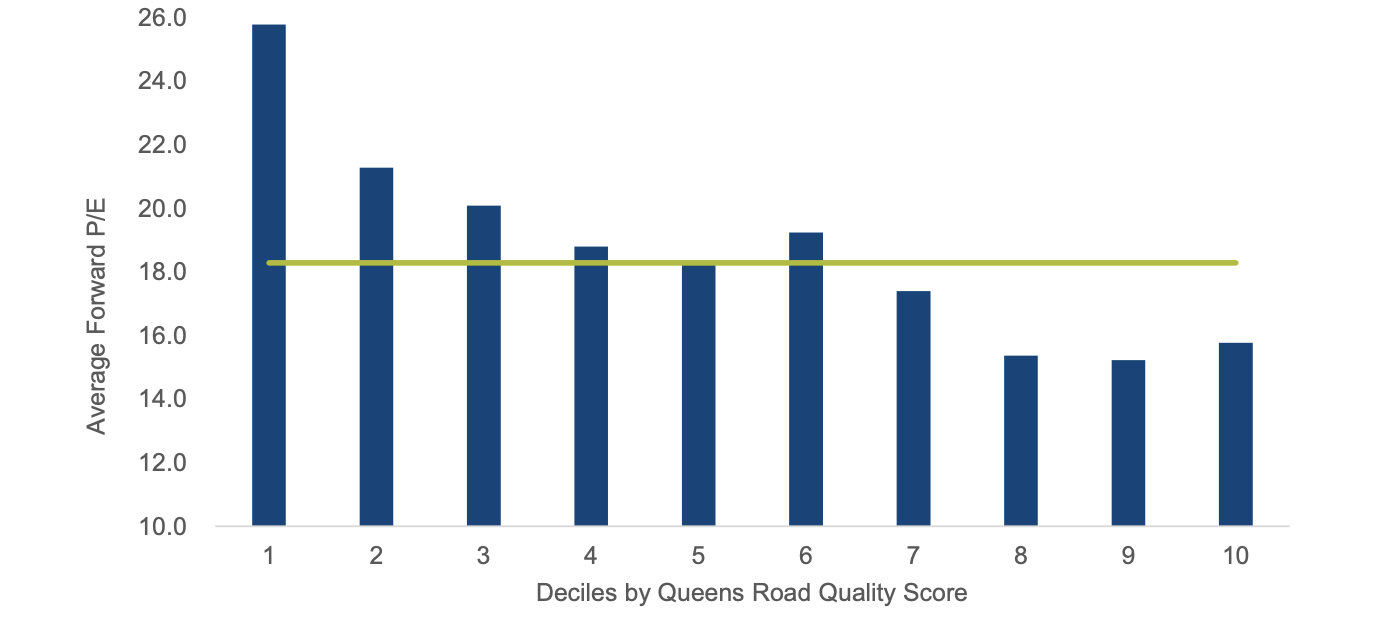
Source: Factset and Bragg Financial. As of June 30, 2025
We can’t help but think that this outcome is consistent with increased passive flows and the general investor disdain for small cap stocks.9 When the marginal buyer is indiscriminate, the active assessment of quality doesn’t matter. We started the Fund in 2002 hoping to add value in a less efficient asset class. And today, it sometimes feels to us like few others are looking at the companies in our portfolio.
A recent paper by Chris Brightman, Cam Harvey and Forrest Henslee of Research Affiliates gives a good summary of the distortions created by passive investing. Research Affiliates concludes that “passive products are indifferent to fundamental information, including sales growth, expected earnings, innovation activities, or competitive position within an industry.” The paper also finds that increased passive investment is a good explanation for the rising correlations and lack of diversification within the indices.10
The chart below shows Morningstar data on flows into actively managed small value mutual funds since 2000. Flows have been negative since 2011 and have averaged a little under -5.1% annually for the past ten years and -5.8% annually for the past five years.
9 Source: CFA Institute, April 24, 2025, Small Caps vs. Large Caps: The Cycle That’s About to Turn; https://blogs.cfainstitute.org/investor/2025/04/24/small-caps-vs-large-caps-the-cycle-thats-about-to-turn/
10 Source: Research Affiliates, “Passive Aggressive: The Increasing Risks of Passive Dominance” by Chris Brightman, Cam Harvey and Forrest Henslee; June 2025. https://www.researchaffiliates.com/publications/articles/1078-passive-aggressive-risks-of-passive- dominance
Actively Managed Small Cap Value Fund Flows
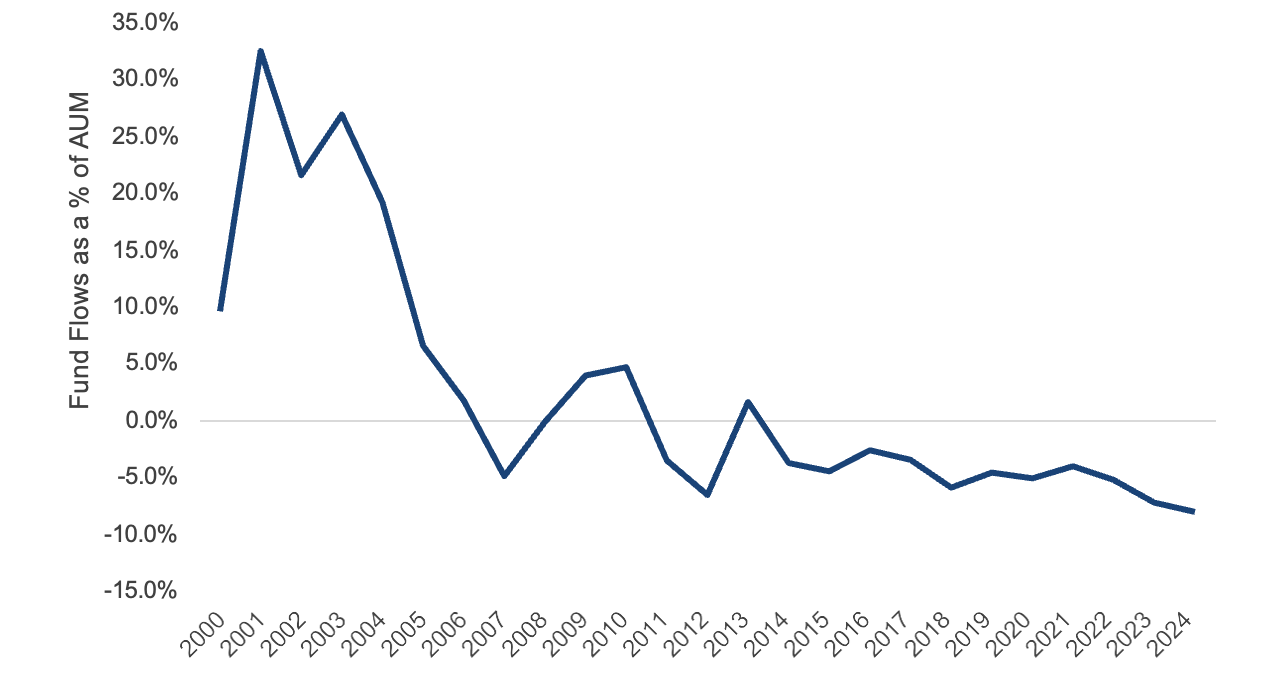
Source: Morningstar. As of December 31, 2024. Chart data from 1/1/2000 to 12/31/2024 showing Morningstar Small Value Category.
When we look at the Fund’s P/E over time, the Fund’s holdings have become modestly cheaper over ten years. The Fund’s performance has been good but has been outpaced by the earnings growth of our portfolio companies and our ability to deploy incremental capital into attractively priced stocks. The Fund owns mostly high-quality companies at reasonable valuations, consistent with the analysis of S&P 600 above. And the Fund’s portfolio P/E statistics match what we see from the bottom up – the portfolio feels attractively priced and balanced right now.
FPA Queens Road Small Cap Value Fund Forward vs Trailing P/E
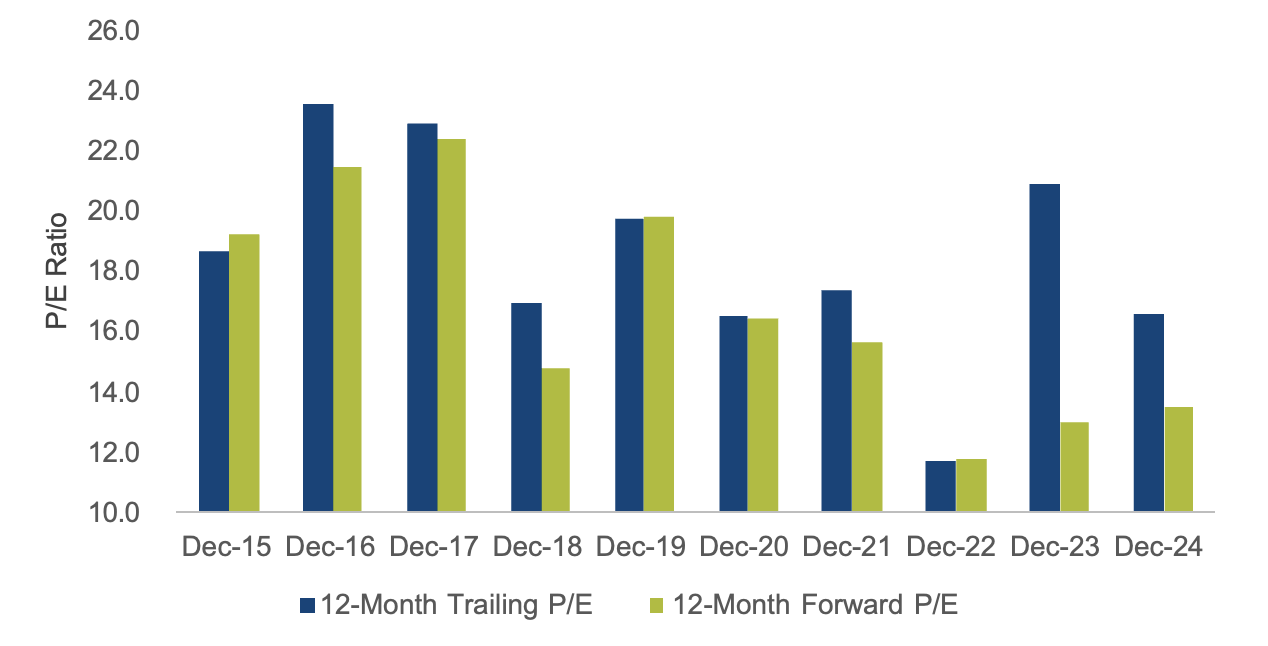
Source: Factset. As of December 31, 2024. Excludes companies with negative earnings.
We began this commentary showing that the current valuations for the S&P 500 are similar to those from the late 1990’s tech bubble. Anecdotally, value investors during that time watched high-quality but lower- growth franchises underperform and cheapen because the rest of the world was piling into technology and growth stocks. When the bubble popped in the early 2000’s, those cheap quality companies had a multi- year run of outperformance driven by rebalanced flows and re-rating. Evaluating expensive large growth companies is beyond our pay grade. But, for the quality small companies that we know best, we think valuations look increasingly attractive.
Top and Bottom Contributors (%)11
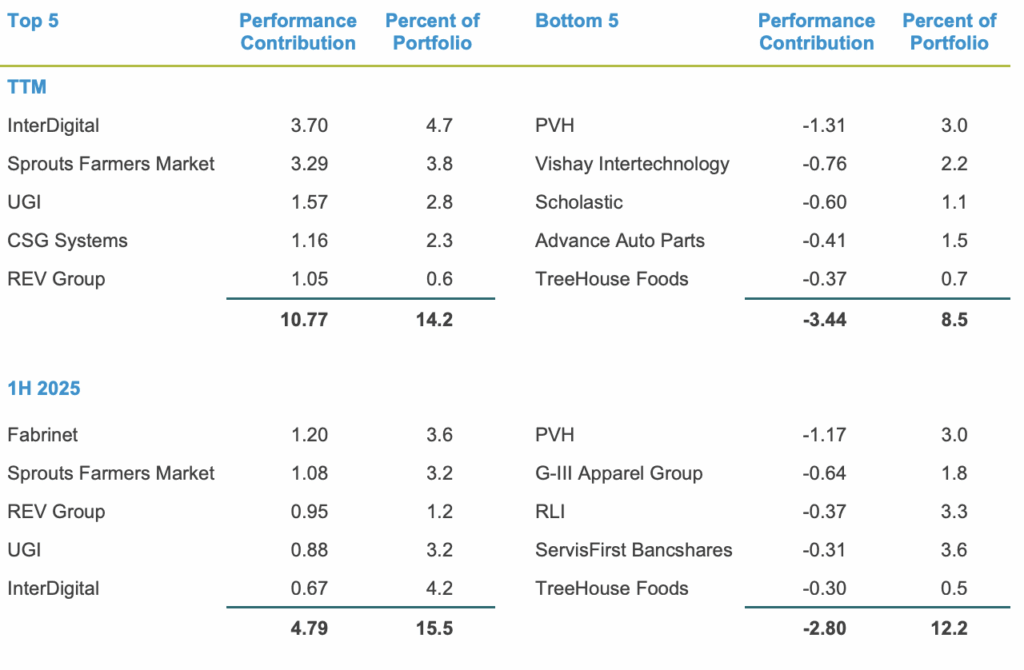
Top Five TTM Contributors12
- InterDigital (IDCC) is a research and development organization that develops and acquires wireless communication and video patents. The company has a history of strong financial performance, opportunistically buys back shares, and pays a modest dividend. IDCC has been successfully renewing its wireless licensing agreements (Apple in 2022, Samsung in 2023) and has a growing stream of recurring licensing revenues across consumer electronics, internet of things (IoT), and automotive customers. CEO Liren Chen joined in 2021 from Qualcom and has been hiring other former Qualcom managers. The company’s share price has increased over the past year on growing revenue, profitability, and buybacks. We began trimming the Fund’s position this year.
- Sprouts Farmers Market (SFM) is a supermarket chain focusing on fresh, natural and organic products. The company has strong operating margins,13 attractive returns on capital and great new store economics. Sprouts accelerated its unit growth from 12 stores a year to 33 stores in 2024 on a base of roughly 400 stores. Over the past year, SFM’s stock has performed extremely well after reporting consistently strong operating results. We have been trimming our position since the third quarter of 2024 and Sprouts now sits outside of our top 10 by weight. Although SFM’s share price has increased faster than bottom line results, we believe SFM still trades in the “range of reasonableness” for a high-quality, non-cyclical franchise that can reinvest capital at attractive rates of return.
- UGI Corp (UGI) is a well run gas and electric utility in Western Pennsylvania and West Virginia. The company also owns a sizable regulated pipeline business, a large propane distribution business in Europe, and Amerigas, the U.S.’s largest propane distributor. UGI has been redirecting cash flow to pay down debt at Amerigas and the utility holding company. We are pleased with the company’s improved financial position and with green shoots at Amerigas.
- CSG Systems (CSGS) makes software that manages customer relationships and billing for telecom companies. Under CEO Brian Shephard, we think the company has done an admirable job adding geographic and customer diversification. On May 7, 2025, CSGS reported strong first quarter earnings results while raising 2025 margin and cash flow guidance. We think that CSGS is attractively priced for a growing, defensive franchise.
- REV Group (REVG) is a specialty vehicle manufacturer. Most of the company’s value is in its municipal business where REV Group makes fire trucks and ambulances. REV Group has been reporting significant backlog and pricing growth in concert with Pierce Manufacturing (owned by Osh Kosh (OSK), another Fund holding), their primary competitor in the fire truck business. CEO Mark Skonieczny has led a significant operational restructuring, sold off the less profitable bus business and used the proceeds to buy back stock at attractive prices. The stock price has followed improving results and has performed well.
Bottom Five TTM Contributors
- PVH (PVH) is an apparel company that owns the Tommy Hilfiger and Calvin Klein brands globally. Most of PVH’s earnings come from Europe, where the Tommy and Calvin brands are considered “almost luxury” and where PVH has demonstrated high single-digit organic growth with pricing power over the preceding decade. CEO Stefan Larsson has done an excellent job revitalizing the company and improving margins at PVH’s moribund U.S. operations. In the company’s most recent fiscal year (ending January 31, 2025), comparable revenue was down 2% as the company bumped into a weaker global consumer and actively cleaned up its channel inventory in Europe. Investors are skittish about tariffs and, in 2024, PVH was added to China’s “Unreliable Entity” list threatening the roughly 15% of the company’s profitability that comes from China. PVH’s sales and sourcing are globally diversified, and the company uses its prodigious cash flow to buy back shares. We think shares are cheap at roughly 6x trailing earnings.
- Vishay Intertechnology (VSH) makes passive electronic components and discrete semiconductors (resistors, inductors, capacitors, MOSFETs, diodes, etc.). Although the industry is cyclical, competitive dynamics are stable and VSH benefits from incremental growth in electric vehicles and industrial electrification. The industry is currently struggling from a cyclical downturn following the excesses and component hoarding of the Covid era. Additionally, at its April 2024 Investor Day, Vishay announced very aggressive 2028 investment and profitability targets with a plan to strategically change the company’s culture that was notably staid and overly-conservative.14 We are cautiously optimistic about Vishay’s growth plans and have been adding to the position during this cyclical weakness.
- Scholastic (SCHL) is an educational publishing company that runs eponymous book fairs in America’s K-12 schools. We first bought shares in 2008 and have added a little over time. Over 15 years, results have been volatile as Scholastic has never been able to translate its name brand, publishing assets, or forays into adjacent markets into consistent earnings. The company has always traded at a discount compared to its economic earnings potential. It also owns prime New York City real estate that we estimate to be worth $300 – $400 million. Poor performance at the company’s book fairs caused the stock to drop 20% following results on July 19, 2024 and another 20% following results reported on December 20, 2024. We’ve added to our position on this weakness.
- Advance Auto Parts (AAP) is an auto parts distributor that sells to both professional repair technicians and retail customers. The company is struggling through a difficult turnaround and sits firmly in our “opportunistic value” bucket. But the balance sheet is in good shape, new management has articulated a credible restructuring plan and the company’s mid-term guidance for 7% operating margins is reasonable compared to competitors and Advance Auto’s own history. On May 22, 2025, the company reported positive operating results indicating that the turnaround is starting to gain traction and the stock has rebounded.
- Treehouse Foods (THS) manufactures private label packaged foods, mostly for grocery chains. The company makes everything from crackers to broths to pickles to cheese. THS never found its footing after levering up for the acquisition of ConAgra’s private label business in 2016, and growth and margins have been inconsistent ever since. Over the last year, continued supply chain and operational issues have weighed on the company’s profitability and stock price. THS was a relatively small position in the Fund and we have been reducing the position.
11 Reflects the top contributors and top detractors to the Fund’s performance based on preliminary contribution to return for the 1H 2025 and the trailing twelve months (TTM) period ending June 30, 2025. Contribution is presented gross of investment management fees, transactions costs, and Fund operating expenses, which if included, would reduce the returns presented. Portfolio weights represent the average weights over the periods noted. A copy of the methodology used and a list of every holding’s contribution to the overall Fund’s performance during the 1H 2025 and TTM is available by contacting [email protected]. It should not be assumed that recommendations made in the future will be profitable or will equal the performance of the securities listed. Totals may not sum due to rounding.
12 Note: any references herein to share to stock price changes may not equate with the performance of the holding in the Fund. Investors can only buy or sell the Fund’s shares at net asset value (NAV). As of June 30, 2025, the percentage weights of the contributors and detractors in the Fund as a percent of net assets, which are subject to change, were: IDCC (3.6%), SFM (2.4%), UGI (3.2%), CSGS (2.6%), REVG (2.7%), PVH (2.7%), VSH (2.8%), SCHL (1.1%), AAP (1.7%), THS (0.3%), FN (4.3%) , GIII (1.6%), RLI (2.8%), SFBS (3.1%)
13 For the year ending Dec-24, Sprout’s operating margin was 6.7%. (Source: Form 10-K for the year ended December 31, 2025).
14 Source: Vishay Intertechnology April 2, 2024 Investor Day; https://ir.vishay.com/events/event-details/investor-day
Conclusion
While we can’t control short term performance, we will continue to manage our portfolio with diligence, discipline, and patience. We never make short-term predictions about market direction, but we feel good about the Fund’s long-term prospects. And we are particularly pleased when we can help protect our clients during bouts of market volatility.
As always, and as significant co-investors in the Fund, we appreciate your trust in us to be good stewards of your capital. If you would like to discuss performance or the Fund’s portfolio holdings in greater detail, please let us know.
Respectfully,
Steve Scruggs, CFA, Portfolio Manager
Ben Mellman, Senior Analyst
June 30, 2025
Important Disclosures
This Commentary is for informational and discussion purposes only and does not constitute, and should not be construed as, an offer or solicitation for the purchase or sale of any securities, products or services discussed, and neither does it provide investment advice. Any such offer or solicitation shall only be made pursuant to the Fund’s Prospectus, which supersedes the information contained herein in its entirety. This Commentary does not constitute an investment management agreement or offering circular.
The statements contained herein reflect the opinions and views of the portfolio managers as of the date written, is subject to change without notice, and may be forward-looking and/or based on current expectations, projections, and/or information currently available. Such information may not be accurate over the long-term. These views may differ from other portfolio managers and analysts of the firm as a whole and are not intended to be a forecast of future events, a guarantee of future results or investment advice.
Portfolio composition will change due to ongoing management of the Fund. References to individual securities or sectors are for informational purposes only and should not be construed as recommendations by the Fund, the portfolio manager, the Adviser, the Sub-Adviser or the distributor. It should not be assumed that future investments will be profitable or will equal the performance of the security or sector examples discussed. The portfolio holdings as of the most recent quarter-end may be obtained at fpa.com.
Future events or results may vary significantly from those expressed and are subject to change at any time in response to changing circumstances and industry developments. The information and data contained herein has been prepared from sources believed reliable, but the accuracy and completeness of the information cannot be guaranteed and is not a complete summary or statement of all available data.
The information contained herein is not complete, may change, and is subject to, and is qualified in its entirety by, the more complete disclosures, risk factors, and other information contained in the Fund’s Prospectus and Statement of Additional Information. The information is furnished as of the date shown. No representation is made with respect to its completeness or timeliness. The information is not intended to be, nor shall it be construed as, investment advice or a recommendation of any kind.
Certain statements contained in this presentation may be forward-looking and/or based on current expectations, projections, and information currently available. Actual events or results may differ from materially those we anticipate, or the actual performance of any investments described herein may differ from those reflected or contemplated in such forward-looking statements, due to various risks and uncertainties. We cannot assure future results and disclaim any obligation to update or alter any forward-looking statements, whether as a result of new information, future events, or otherwise. Such statements may or may not be accurate over the long-term. Statistical data or references thereto were taken from sources which we deem to be reliable, but their accuracy cannot be guaranteed.
The reader is advised that the Fund’s investment strategy includes active management with corresponding changes in allocations from one period of time to the next. Therefore, any data with respect to investment allocations as of a given date is of limited use and may not be reflective of the portfolio manager’s more general views with respect to proper geographic, instrument and /or sector allocations. The data is presented for indicative purposes only and, as a result, may not be relied upon for any purposes whatsoever.
In making any investment decision, you must rely on your own examination of the Fund, including the risks involved in an investment. Investments mentioned herein may not be suitable for all recipients and in each case, potential investors are advised not to make any investment decision unless they have taken independent advice from an appropriately authorized advisor. An investment in any security mentioned herein does not guarantee a positive return as securities are subject to market risks, including the potential loss of principal. You should not construe the contents of this document as legal, tax, investment or other advice or recommendations.
Fund performance presented is calculated on a total return basis, which includes the reinvestment of all income, plus realized and unrealized gains/losses, if applicable. Unless otherwise indicated, performance results are presented on a net of fees basis and reflect the deduction of, among other things: management fees, brokerage commissions, operating and administrative expenses, and accrued performance fee/allocation, if applicable.
The information provided in this presentation is based upon data existing as of the date(s) of the report and has not been audited or reviewed. While we believe the information to be accurate, it is subject in all respects to adjustments that may be made after proper review and reconciliation.
Investments carry risks and investors may lose principal value. Capital markets are volatile and can decline significantly in response to adverse issuer, political, regulatory, market, or economic developments. Securities of smaller, less well- known companies involve greater risks and they can fluctuate in price more than larger company securities. You risk paying more for a security than you received from its sale.
The Fund primarily invests in equity securities (common stocks, preferred stocks and convertible securities) of small- capitalization U.S. companies, defined as those with market-capitalization, at the time of purchase, that is no greater than the largest market-capitalization of any company included in the Russell 2000 Index. Investing in small companies involves special risks including, but not limited to, the following: smaller companies typically have more risk and their company stock prices are more volatile than that of large companies; their securities may be less liquid and may be thinly traded which makes it more difficult to dispose of them at prevailing market prices; these companies may be more adversely affected by poor economic or market conditions; they may have limited product lines, limited access to financial resources, and may be dependent on a limited management group; and small-cap stocks may fluctuate independently of large-cap stocks. All investment decisions are made at the discretion of the Portfolio Manager, in accordance with the then current Prospectus. Comparison to any index is for illustrative purposes only.
The prices of securities held by the Fund may decline in response to certain events taking place around the world, including those directly involving the companies whose securities are owned by the Fund. Securities in the Fund’s portfolio may underperform due to inflation (or expectations for inflation), interest rates, global demand for particular products or resources, natural disasters, pandemics, epidemics, terrorism, regulatory events and governmental or quasi-governmental actions. There is a risk that you may lose money by investing in the Fund.
Value style investing presents the risk that the holdings or securities may never reach their full market value because the market fails to recognize what the portfolio management team considers the true business value or because the portfolio management team has misjudged those values. In addition, value style investing may fall out of favor and underperform growth or other styles of investing during given periods.
Please refer to the Fund’s Prospectus for a complete overview of the primary risks associated with the Fund.
The FPA Funds are distributed by Distribution Services, LLC. 190 Middle Street, Suite 301, Portland, ME 04101. Distribution Services, LLC and FPA are not affiliated.
Index / Category Definitions
Comparison to any index or benchmark is for illustrative purposes only and should not be relied upon as a fully accurate measure of comparison. The Fund may be less diversified than the indices noted herein and may hold non-index securities or securities that are not comparable to those contained in an index. Indices will hold positions that are not within the Fund’s investment strategy. Indices are unmanaged and do not reflect any commissions, transaction costs, or fees and expenses which would be incurred by an investor purchasing the underlying securities and which would reduce the performance in an actual account. You cannot invest directly in an index.
The Russell 2000 Index measures the performance of the small-cap segment of the U.S. equity universe. It is a market cap weighted index that includes the smallest 2,000 companies covered in the Russell 3000 universe of United States- based listed equities.
The Russell 2000 Value Index measures the performance of the small-cap value segment of the U.S. equity universe. It includes those Russell 2000 companies that are considered more value oriented relative to the overall market as defined by Russell’s leading style methodology.
Standard & Poor’s 500 Stock Index (S&P 500) is a-capitalization-weighted index which covers industrial, utility, transportation and financial service companies, and represents approximately 75% of the New York Stock Exchange (NYSE) capitalization and 30% of NYSE issues. The S&P 500 is considered a measure of large-capitalization stock performance.
Standard & Poor’s 600 Stock Index (S&P 600) is an index of small-cap stocks managed by Standard & Poor’s. It tracks a broad range of small-sized companies that meet specific liquidity and stability requirements. This is determined by specific metrics such as public float, market capitalization, and financial viability, among other factors.
Small-cap Value Companies: The term small-cap describes companies with a relatively small market-capitalization. A company’s market-capitalization is the market value of its outstanding shares. The definition for small-cap varies, but generally means a company with $300 million to $2 billion in market-capitalization.
Glossary of Terms
Downside-capture ratio is used to evaluate how well an investment manager performed relative to an index during periods when that index has fallen. The ratio is calculated by dividing the manager’s returns by the returns of the index during the down market, and multiplying that factor by 100. BPS or basis points; 1 bps is equal to 0.01%.
Earnings per share (EPS) is calculated as a company’s profit divided by the outstanding shares of its common stock.
Expected earnings are an estimate for a company’s future quarterly or annual earnings per share (EPS).
Forward earnings are an estimate of the next period’s earnings of a company, usually through the completion of the current fiscal year and sometimes to the following fiscal year.
Free Cash Flow represents the cash a company can generate after required investment to maintain or expand its asset base.
Margin of Safety – Buying with a “margin of safety” is when a security is purchased at a discount to the portfolio manager’s estimate of its intrinsic value. Buying a security with a margin of safety is designed to protect against permanent capital loss in the case of an unexpected event or analytical mistake. A purchase made with a margin of safety does not guarantee the security will not decline in price.
Market Cycle Performance is defined as a period that contains a decline of at least 20% from the previous market peak over at least a two-month period and a rebound to establish a new peak above the prior market peak.
Price/Earnings Ratio (P/E) is the price of a stock divided by its earnings per share. Percentages are based on the absolute number of shares. P/E ex-Neg EPS is Price/Earnings ex negative earnings per share. P/E, average P/E, or P/E (trailing) is based on the last 12 months of actual earnings. P/E, next 12 months or P/E (forward) utilizes forward earnings expectations over the next 12 months to calculate the ratio.
Return on Equity (ROE) measures a corporation’s profitability by revealing how much profit a company generates with the money shareholders have invested.
©2025 Morningstar, Inc. All Rights Reserved. The Morningstar information contained herein: (1) is proprietary to Morningstar and/or its content providers; (2) may not be copied or distributed; and (3) is not warranted by Morningstar to be accurate, complete, or timely. Neither Morningstar nor its content providers are responsible for any damages or losses arising from any use of this information. Past performance is no guarantee of future results.