
Unless otherwise noted, all figures and opinions are as of March 20, 2020 and are preliminary and subject to change.
FPA New Income, Inc. Update
| FPNIX 12/231/2019 | FPNIX 3/20/2020 | BbgBarc US Agg Bond Index 3/20/200 | BbgBarc US Agg 1-3 Yr 3/20/2020 | |
|---|---|---|---|---|
| Yield-to-worst1 | 2.71% | 4.04% | 2.18% | 1.52% |
| Subsidized SEC Yield2 | 2.50% | N/A | N/A | N/A |
| Effective Duration (years) | 1.57 | 1.43 | 5.86 | 1.92 |
| FPNIX3 | % Portfolio 12/31/2019 | % Portfolio 3/20/2020 |
|---|---|---|
| AAA | 81.3 | 80.7 |
| AA | 8.7 | 9.5 |
| A | 3.4 | 3.3 |
| BBB | 0.1 | 0.1 |
| BB | 1.0 | 0.4 |
| B & Below | 3.3 | 3.3 |
| Non-rated | 2.2 | 2.7 |
| Total High Quality | 93.4 | 93.5 |
| Total Credit Sensitive | 6.6 | 6.5 |
| Total | 100.0 | 100.0 |
| FPNIX3 | % Portfolio 12/31/2019 | % Portfolio 3/20/2020 |
|---|---|---|
| ABS4 | 52.1 | 58.2 |
| Mortgage Backed (CMO)5 | 9.3 | 7.9 |
| Stripped Mortgage-backed | 2.6 | 2.3 |
| Corporate | 6.3 | 6.6 |
| CMBS5 | 6.1 | 7.3 |
| Mortgage Pass-through | 8.4 | 4.4 |
| U.S. Treasury | 6.9 | 8.1 |
| Agencies | 1.2 | 1.2 |
| Cash and Equivalents | 7.1 | 4.1 |
| Total | 100.0 | 100.0 |
FPA Flexible Fixed Income Fund Update
| FPFIX 12/31/2019 | FPFIX 3/20/20 | BbgBarc US Universal Index 3/20/2020 | |
|---|---|---|---|
| Yield-to-worst6 | 2.80% | 3.75% | 2.92% |
| Subsidized SEC Yield7 | 2.72% | N/A | N/A |
| Effective Duration (years) | 1.74 | 1.58 | 5.71 |
| FPFIX8 | % Portfolio 12/31/2019 | % Portfolio 3/20/2020 |
|---|---|---|
| AAA | 81.3 | 80.7 |
| AA | 8.7 | 9.5 |
| A | 3.4 | 3.3 |
| BBB | 0.1 | 0.1 |
| BB | 1.0 | 0.4 |
| B & Below | 3.3 | 3.3 |
| Non-rated | 2.2 | 2.7 |
| Total High Quality | 93.4 | 93.5 |
| Total Credit Sensitive | 6.6 | 6.5 |
| Total | 100.0 | 100.0 |
| FPFIX8 | % Portfolio 12/31/2019 | % Portfolio 3/20/2020 |
|---|---|---|
| ABS4 | 33.5 | 47.9 |
| Mortgage Backed (CMO)5 | 6.3 | 7.1 |
| Stripped Mortgage-backed | 0.5 | 0.4 |
| Corporate | 9.2 | 10.6 |
| CMBS | 12.6 | 12.6 |
| Mortgage Pass-through | 18.5 | 6.9 |
| U.S. Treasury | 6.9 | 7.9 |
| Cash and Equivalents | 12.5 | 6.5 |
| Total | 100.0 | 100.0 |
Fund Comments
- FPA New Income’s yield-to-worst is higher than FPA Flexible Fixed Income’s yield-to-worst because FPA New Income owns more bonds that are priced at less than par and have an average life of less than one year.
- The combination of the less than one year maturity and below par dollar price leads to an annualized yieldto-worst greater than the expected total return on the bonds.
- In the past few weeks we have seen attempts in the market to sell large amounts of investment grade, short maturity bonds to raise liquidity resulting in relatively greater pricing pressure on these types of bonds.
Update on the Market:
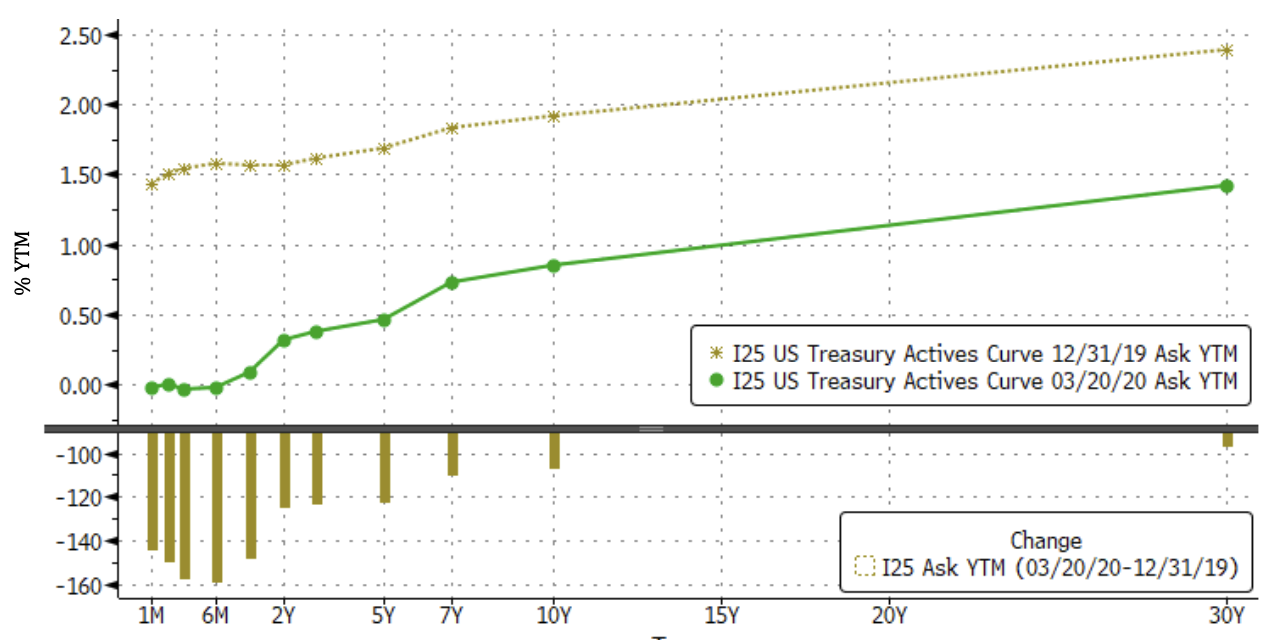
Source: Bloomberg. Data as of March 20,2020.
ABS Spread
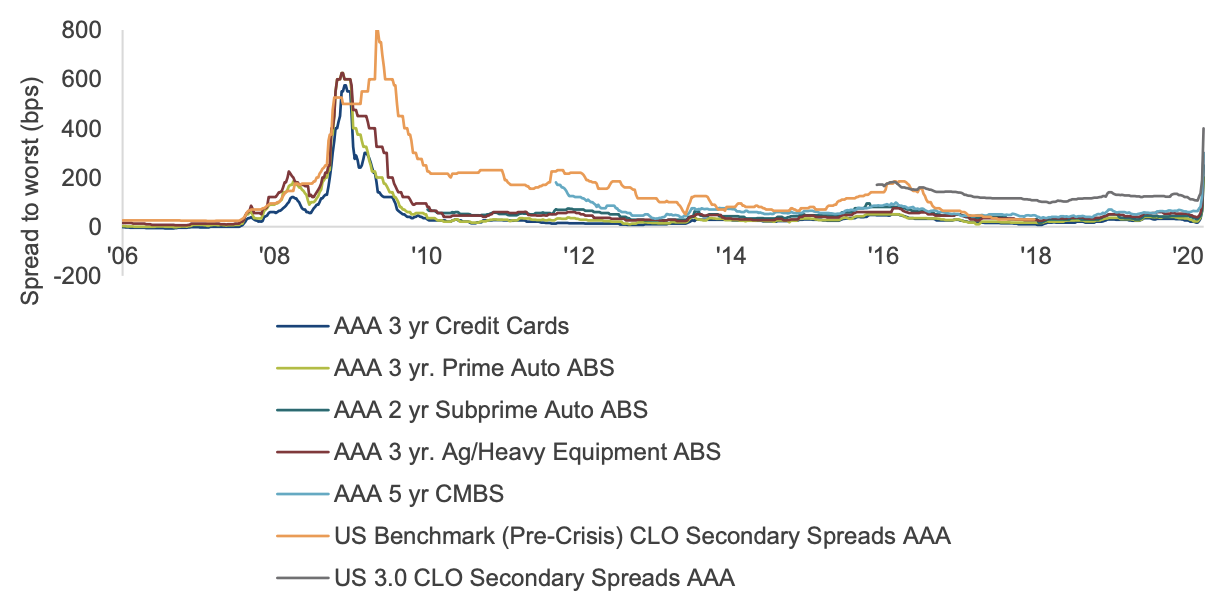
| Spread to worst (bps) | 12/26/2019 | 3/19/2020 |
|---|---|---|
| AAA 3 yr Credit Cards | 26 | 200 |
| AAA 3 yr Prime Auto ABS | 33 | 200 |
| AAA 2 yr Subprime Auto ABS | 44 | 250 |
| AAA 3 yr Ag/Heavy Equipment ABS | 53 | 300 |
| AAA 5 yr CMBS | 62 | 300 |
| US Benchmark (Pre-Crisis) CLO Secondary Spreads AAA | N/A | N/A |
| US 3.0 CLO Secondary Spreads AAA | 120 | 400 |
Source: J.P. Morgan. Chart data from January 5, 2006 through March 19, 2020. ABS = Asset-Backed Security
Bloomberg Barclays HY Index
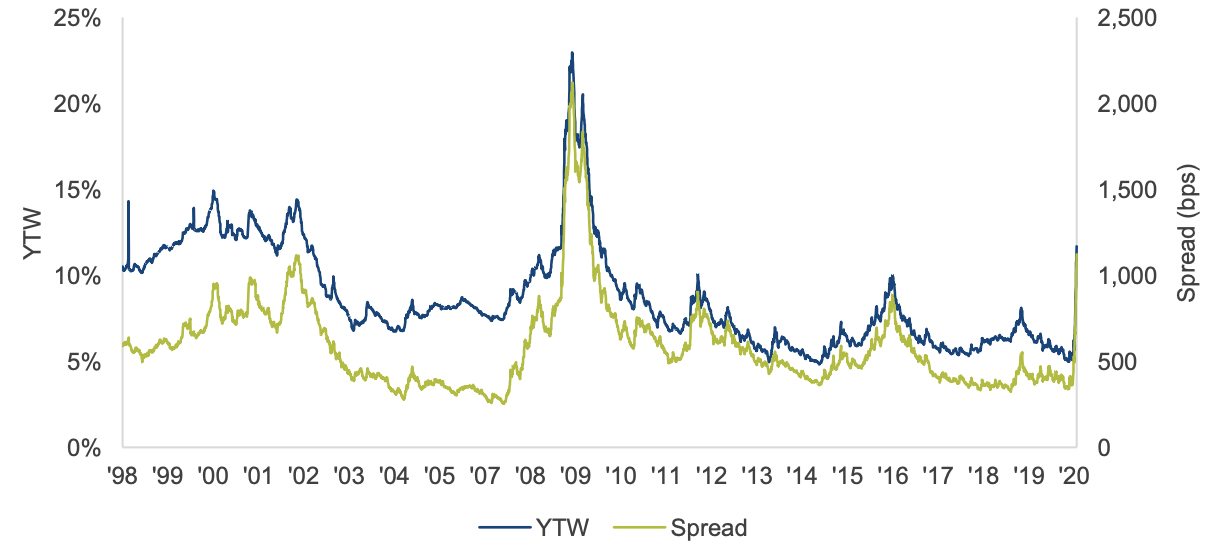
| 12/31/2019 | 3/23/2022 | |
|---|---|---|
| Spread (bps) | 357 | 1,123 |
| YTW | 5.19% | 11.69% |
Source: Bloomberg Barclays. Chart data is from November 1, 1998 through March 23, 2020
Bloomberg Barclays HY BB Index Excl. Energy
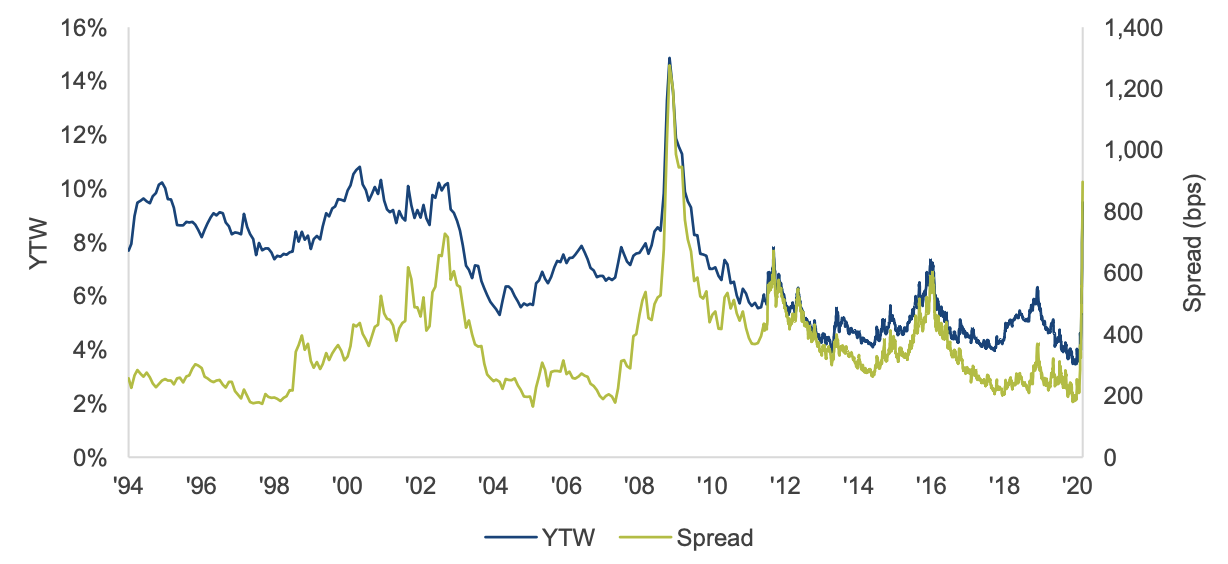
| 12/31/2019 | 3/23/2022 | |
|---|---|---|
| Spread (bps) | 199 | 897 |
| YTW | 3.63% | 9.49% |
Source: Bloomberg Barclays. Chart data is from January 1, 1994 through March 23, 2020
Leveraged Loan Index YTD Through 3/20/2020 Price Change
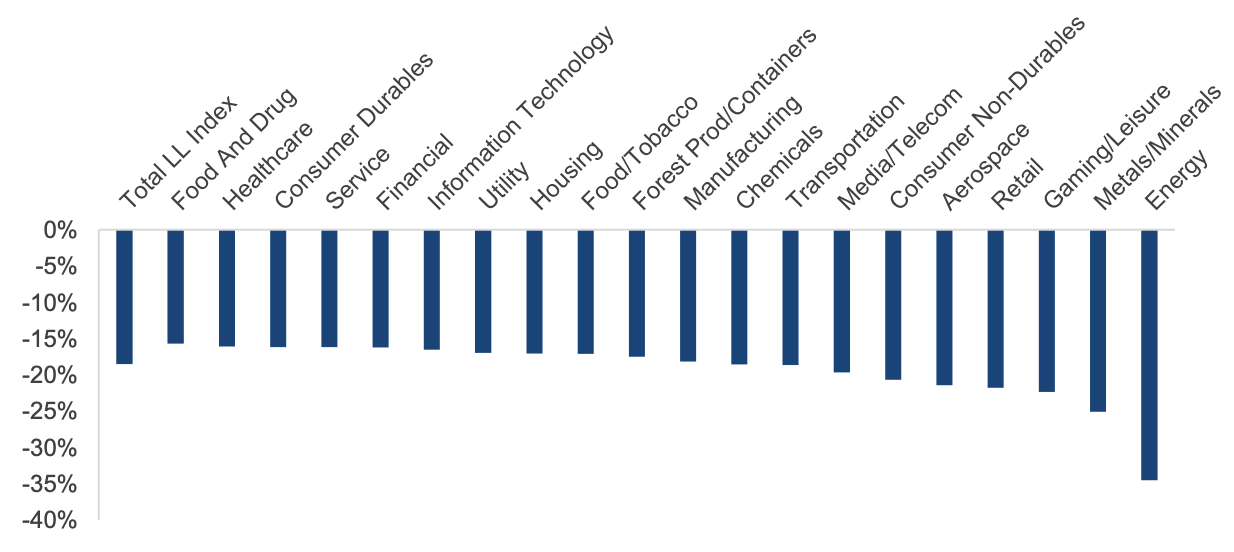
Source: Credit Suisse
Leveraged Loan Index
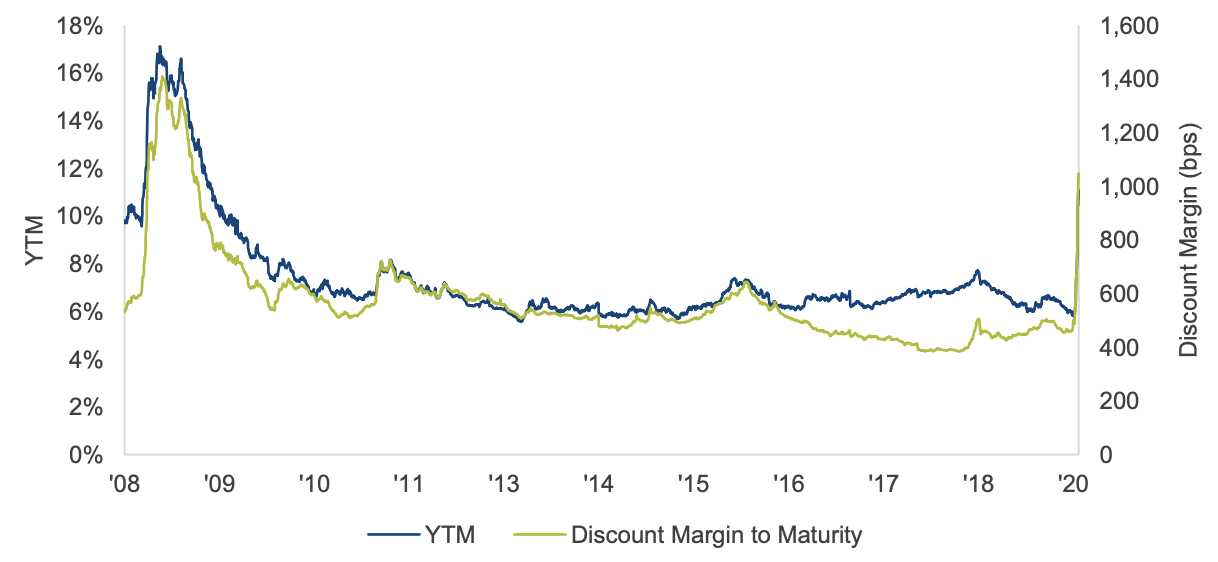
| 12/31/2019 | 3/23/2022 | |
|---|---|---|
| Discount Margin to Maturity (bps) | 471 | 1,047 |
| YTM | 6.43% | 11.08% |
Source: Credit Suisse. Chart data is from June 30, 2008 through March 23, 2020.
Average Annual Total Returns (%) – FPNIX
| As of December 31, 2019 | 30 Years | 20 Years | 15 Years | 10 Years | 5 Years | 3 Years | 1 Year | YTD | QTR |
|---|---|---|---|---|---|---|---|---|---|
| FPA New Income, Inc. | 5.40 | 3.85 | 2.70 | 2.10 | 2.28 | 2.92 | 3.81 | 3.81 | 0.33 |
| BbgBarc US Agg Bond | 5.90 | 5.03 | 4.15 | 3.75 | 3.05 | 4.03 | 8.72 | 8.72 | 0.18 |
| CP1 + 100 bps | 3.45 | 3.18 | 3.04 | 2.77 | 2.84 | 3.14 | 3.31 | 3.31 | 1.09 |
| BBgBarc US Aggregate 1-3 Yr | N/A | 3.23 | 2.53 | 1.56 | 1.69 | 2.16 | 4.04 | 4.04 | 0.57 |
Average Annual Total Returns (%) – FPFIX
| As of December 31. 2019 | Since Inception 12/31/2019 | 1 Year | QTD |
|---|---|---|---|
| FPA Flexible Fixed Income Fund | 3.78 | 3.78 | 0.42 |
| BBgBarc US Universal Bond Index | 9.29 | 9.29 | 0.45 |
| CPI + 200 bps | 4.35 | 4.35 | 1.34 |
Past performance is no guarantee of future results and current performance may be higher or lower than the performance shown. This data represents past performance and investors should understand that investment returns and principal values fluctuate, so that when you redeem your investment it may be worth more or less than its original cost. Current month-end performance data, which may be higher or lower than the performance data quoted, may be obtained at www.fpa.com or by calling toll-free, 1-800-982-4372.
You should consider each Fund’s investment objectives, risks, and charges and expenses carefully before you invest. The Prospectus for each Fund details each Fund’s objective and policies, charges, and other matters of interest to a prospective investor. Please read the Prospectus carefully before investing. The Prospectus for each Fund may be obtained by visiting the website at www.fpa.com, by email at [email protected], toll-free by calling 1-800-982-4372 or by contacting the Funds in writing.
Periods greater than one year are annualized. FPA New Income, Inc. and FPA Flexible Fixed Income Fund (each a “Fund” and collectively the “Funds”) performance is calculated on a total return basis which includes reinvestment of all distributions and is net of all fees and expenses. The Funds’ returns do not reflect the deduction of taxes that a shareholder would pay on Funds’ distributions or the redemption of Funds’ shares, which would lower these figures. Comparison to any index is for illustrative purposes only. The Funds do not include outperformance of any index or benchmark in its investment objectives. An investor cannot invest directly in an index.
FPA New Income, Inc.’s Total Annual Fund Operating Expenses before reimbursement is 0.57% (as of most recent prospectus). The Advisor has contractually agreed to reimburse the Fund for Total Annual Fund Operating Expenses in excess of 0.50% of the average net assets of the Fund (excluding interest, taxes, brokerage fees and commissions payable by the Fund in connection with the purchase or sale of portfolio securities, and extraordinary expenses, including litigation expenses not incurred in the Fund’s ordinary course of business) through January 31, 2021. This agreement may only be terminated earlier by the Fund’s Board of Directors (the “Board”) or upon termination of the Advisory Agreement. The Fund’s net expense ratio as of its most recent prospectus is 0.50%.
FPA Flexible Fixed Income Fund’s Total Annual Fund Operating Expenses before reimbursement is 0.97% (as of most recent prospectus). The Advisor has contractually agreed to reimburse the Fund for Total Annual Fund Operating Expenses (excluding interest, taxes, brokerage fees and commissions payable by the Fund in connection with the purchase or sale of portfolio securities, and extraordinary expenses, including litigation expenses not incurred in the Fund’s ordinary course of business) in excess of 0.39% of the average net assets of the Fund through December 31, 2020, in excess of 0.49% of net assets of the Fund for the year ended December 31, 2021, and in excess of 0.59% of net assets of the Fund for the year ended December 31, 2022. During the term of the current expense limit agreement, beginning December 31, 2018 and ending December 31, 2021, any expenses reimbursed to the Fund by FPA during any of the previous 36 months may be recouped by FPA, provided the Fund’s Total Annual Fund Operating Expenses do not exceed the then-applicable expense limit. Beginning January 1, 2022, any expenses reimbursed to the Fund by FPA during any of the previous 36 months may be recouped by FPA, provided the Fund’s Total Annual Fund Operating Expenses do not exceed 0.64% of average net assets of the Fund for any subsequent calendar year, regardless of whether there is a then-effective higher expense limit. This agreement may only be
terminated earlier by the Fund’s Board of Trustees (the “Board”) or upon termination of the Advisory Agreement.
1 Yield to Worst (“YTW”) is presented gross of fees and reflects the lowest possible yield on a callable bond without the issuer defaulting. It does not represent the yield an investor should expect to receive.
2 As of December 31, 2019, FPNIX subsidized/unsubsidized 30-day SEC standardized yield (“SEC Yield”) was 2.50%/2.43% respectively. The SEC Yield calculation is an annualized measure of FPNIX dividend and interest payments for the last 30 days, less FPNIX expenses. Subsidized yield reflects fee waivers and/or expense reimbursements during the period. Without waivers and/or reimbursements, yields would be reduced. Unsubsidized yield does not adjust for any fee waivers and/or expense reimbursements in effect. The SEC Yield calculation is based on the price of the FPNIX at the beginning of the month.
3 Source: FactSet. The Barclays Capital Family of Indices ratings rules use the median if more than two ratings are available from all NRSROs. Lower of the two is used if only two ratings are available from all NRSROs. ‘Credit Sensitive’ are investments rated BBB+ and below. Portfolio composition will change due to ongoing management of FPNIX. Totals may not add due to rounding.
4 ABS (Asset Backed Securities) are financial securities backed by a loan, lease or receivables against assets other than real estate and mortgage-backed securities.
5 Collateralized mortgage obligations (“CMO”) are mortgage-backed bonds that separate mortgage pools into different maturity classes. Commercial mortgage-backed securities (“CMBS”) are securities backed by commercial mortgages rather than residential mortgages.
Past performance is no guarantee, nor is it indicative, of future results. Please refer to the end of this document for important disclosures and key definitions.
6 Yield to Worst (“YTW”) is presented gross of fees and reflects the lowest possible yield on a callable bond without the issuer defaulting.
It does not represent the yield an investor should expect to receive.
7 As of December 31, 2019, FPFIX subsidized/unsubsidized 30-day SEC standardized yield (“SEC Yield”) was 2.72%/1.93% respectively. The SEC Yield calculation is an annualized measure of FPFIX dividend and interest payments for the last 30 days, less FPFIX expenses. Subsidized yield reflects fee waivers and/or expense reimbursements during the period. Without waivers and/or reimbursements, yields would be reduced. Unsubsidized yield does not adjust for any fee waivers and/or expense reimbursements in effect. The SEC Yield calculation is based on the price of FPFIX at the beginning of the month.
8 Source: FactSet. The Barclays Capital Family of Indices ratings rules use the median if more than two ratings are available from all NRSROs. Lower of the two is used if only two ratings are available from all NRSROs. ‘Credit Sensitive’ are investments rated BBB+ and below. Portfolio composition will change due to ongoing management of FPFIX. Totals may not add due to rounding.
Past performance is no guarantee, nor is it indicative, of future results. Please refer to the end of this document for important
disclosures and key definitions.
Important Disclosures
This update is for informational and discussion purposes only and does not constitute, and should not be construed as, an offer or solicitation for the purchase or sale of any securities, products or services discussed, and neither does it provide investment advice. Any such offer or solicitation shall only be made pursuant to the Fund’s Prospectus, which supersedes the information contained herein in its entirety.
The views expressed herein and any forward-looking statements are as of the date of the publication and are those of the portfolio management team. Future events or results may vary significantly from those expressed
and are subject to change at any time in response to changing circumstances and industry developments. This information and data has been prepared from sources believed reliable, but the accuracy and completeness of the information cannot be guaranteed and is not a complete summary or statement of all available data.
Thomas Atteberry and Abhijeet Patwardhan have been portfolio managers for FPA New Income, Inc. since November 2004 and November 2015, respectively, and manage the Fund in a manner that is substantially similar to the prior portfolio manager, Robert Rodriguez. Mr. Rodriguez ceased serving as the Fund’s portfolio manager effective December 2009.
Portfolio composition will change due to ongoing management of the Funds. References to individual securities or sectors are for informational purposes only and should not be construed as recommendations by the Funds, the portfolio managers, the Adviser, or the distributor. It should not be assumed that future investments will be profitable or will equal the performance of the security or sector examples discussed. The portfolio holdings as of the most recent quarter-end may be obtained at www.fpa.com.
Investments, including investments in mutual funds, carry risks and investors may lose principal value. Capital markets are volatile and can decline significantly in response to adverse issuer, political, regulatory, market, or economic developments. The Funds may purchase foreign securities, including American Depository Receipts (ADRs) and other depository receipts, which are subject to interest rate, currency exchange rate, economic and political risks; this may be enhanced when investing in emerging markets. Foreign investments, especially those of companies in emerging markets, can be riskier, less liquid, harder to value, and more volatile than investments in the United States. The securities of smaller, less well-known companies can be more volatile than those of larger companies.
The return of principal in a bond fund is not guaranteed. Bond funds have the same issuer, interest rate, inflation and credit risks that are associated with underlying bonds owned by the Funds. Lower rated bonds, convertible securities and other types of debt obligations involve greater risks than higher rated bonds.
Interest rate risk is the risk that when interest rates go up, the value of fixed income securities, such as bonds, typically go down and investors may lose principal value. Credit risk is the risk of loss of principal due to the issuer’s failure to repay a loan. Generally, the lower the quality rating of a security, the greater the risk that 10 the issuer will fail to pay interest fully and return principal in a timely manner. If an issuer defaults the security may lose some or all of its value.
Mortgage securities and collateralized mortgage obligations (CMOs) are subject to prepayment risk and the risk of default on the underlying mortgages or other assets; such derivatives may increase volatility. Convertible securities are generally not investment grade and are subject to greater credit risk than higherrated investments. High yield securities can be volatile and subject to much higher instances of default.
Value style investing presents the risk that the holdings or securities may never reach their full market value because the market fails to recognize what the portfolio management team considers the true business value or because the portfolio management team has misjudged those values. In addition, value style investing may fall out of favor and underperform growth or other styles of investing during given periods.
The ratings agencies that provide ratings are Standard and Poor’s, Moody’s, and Fitch. Credit ratings are Standard and Poor’s, Moody’s, and Fitch. Credit ratings range from AAA (highest) to D (lowest). Bonds rated BBB or above are considered investment grade. Credit ratings of BB and below are lower-rated securities (junk bonds). High-yielding, non-investment grade bonds (junk bonds) involve higher risks than investment grade bonds. Bonds with credit ratings of CCC or below have high default risk.
Index and Other Definitions
Comparison to any index is for illustrative purposes only and should not be relied upon as a fully accurate measure of comparison. The Funds will be less diversified than the indices noted herein, and may hold nonindex securities or securities that are not comparable to those contained in an index. Indices will hold positions that are not within the Funds’ investment strategies. Indices are unmanaged, do not reflect any commissions, fees or expenses which would be incurred by an investor purchasing the underlying securities. The Funds does not include outperformance of any index or benchmark in their investment objectives. Investors cannot invest directly in an index.
Bloomberg Barclays US Aggregate Bond Index provides a measure of the performance of the U.S. investment grade bonds market, which includes investment grade U.S. Government bonds, investment grade corporate bonds, mortgage pass-through securities and asset-backed securities that are publicly offered for sale in the United States. The securities in the Index must have at least 1 year remaining in maturity. In addition, the securities must be denominated in U.S. dollars and must be fixed rate, nonconvertible, and taxable.
Bloomberg Barclays US Aggregate 1-3 Year Index provides a measure of the performance of the U.S. investment grade bonds market, which includes investment grade U.S. Government bonds, investment grade corporate bonds, mortgage pass-through securities and asset-backed securities that are publicly offered for sale in the United States. The securities in the Index must have a remaining maturity of 1 to 3 years. In addition, the securities must be denominated in U.S. dollars and must be fixed rate, nonconvertible, and taxable.
Bloomberg Barclays U.S. High Yield Index measures the market of USD-denominated, non-investment grade, fixed-rate, taxable corporate bonds.
Bloomberg Barclays BB U.S. High Yield Index ex. Energy measures the market of USD-denominated, non-investment grade, fixed-rate, taxable corporate bonds rated BB excluding energy sector. Bloomberg Barclays U.S. Universal Bond Index represents the union of the following Bloomberg Barclay’s indices: U.S. Aggregate Index, the U.S. Corporate High-Yield Index, the 144A Index, the Eurodollar Index, the Emerging Markets Index, and the non-ERISA portion of the CMBS Index. Municipal debt, private placements, and non-dollar-denominated issues are excluded from the Universal Index. The only constituent of the index that includes floating-rate debt is the Emerging Markets Index.
The Consumer Price Index (CPI) is an unmanaged index representing the rate of the inflation of U.S. consumer prices as determined by the U.S. Department of Labor Statistics. The CPI is presented to illustrate the Fund’s purchasing power against changes in the prices of goods as opposed to a benchmark, which is used to compare the Fund’s performance. There can be no guarantee that the CPI will reflect the exact level of inflation at any given time. This index reflects non-seasonally adjusted returns.
CPI + 100 bps is the measure of the CPI plus an additional 100 basis points.
CPI + 200 bps is the measure of the CPI plus an additional 200 basis points.
Credit Suisse Leveraged Loan Index is designed to mirror the investable universe of U.S. dollar institutional leveraged loans, including U.S. and international borrowers.
Basis Point (bps) is equal to one hundredth of one percent, or 0.01%. 100 basis points = 1%.
Effective Duration (years) is the duration calculation for bonds with embedded options. Effective duration takes into account that expected cash flows will fluctuate as interest rates change.
Spread to swap is the difference between the fixed component of a given swap and the yield on a sovereign debt security with a similar maturity. In the U.S, the latter would be a U.S. Treasury security.
Yield to Maturity is the rate of return anticipated on a bond if held until the end of its lifetime. YTM is considered a long-term bond yield expressed as an annual rate. The YTM calculation takes into account the bond’s current market price, par value, coupon interest rate and time to maturity. It is also assumed that all coupon payments are reinvested at the same rate as the bond’s current yield.
Yield to Worst is the lowest amount that an investor will make from a bond, computed by using the lower of the yield to maturity and the yield to call on every call date.
Past performance is no guarantee of future results.
The FPA Funds are distributed by UMB Distribution Services, LLC, 235 W. Galena Street, Milwaukee, WI, 53212.