You should consider the Fund’s investment objectives, risks, and charges and expenses carefully before you invest. The Prospectus details the Fund’s objective and policies, charges, and other matters of interest to a prospective investor. Please read the Prospectus carefully before investing. The Prospectus may be obtained by visiting the website at fpa.com, by email at [email protected], toll-free by calling 1-800-982-4372 or by contacting the Fund in writing.
Average Annual Total Returns (%)
| As of March 31, 2026 | 40 Yr | 30 Yr | 20 Yr | 15 Yr | 10 Yr | 5 Yr | 3 Yr | 1 Yr | YTD | QTD |
|---|---|---|---|---|---|---|---|---|---|---|
| FPA New Income (FPNIX) | 5.42 | 3.93 | 2.88 | 2.42 | 3.01 | 3.31 | 5.83 | 4.81 | 0.17 | 0.17 |
| Bloomberg U.S. Aggregate | 5.34 | 4.28 | 3.28 | 2.39 | 1.70 | 0.31 | 3.63 | 4.35 | -0.05 | -0.05 |
| CPI + 100 | 3.84 | 3.57 | 3.58 | 3.68 | 4.36 | 5.55 | 4.08 | 4.32 | 1.56 | 1.56 |
| Bloomberg U.S. Aggregate 1-3 Yr | – | – | 2.45 | 1.73 | 2.01 | 2.06 | 4.40 | 4.03 | 0.32 | 0.32 |
Index data source: Morningstar.
Past performance is no guarantee of future results and current performance may be higher or lower than the performance shown. This data represents past performance and investors should understand that investment returns and principal values fluctuate, so that when you redeem your investment it may be worth more or less than its original cost. Current month-end performance data, which may be higher or lower than the performance data quoted, may be obtained at fpa.com or by calling toll-free, 1-800-982-4372. As of its most recent prospectus, the Fund’s total expense ratio is 0.59% for the Institutional Class and 0.77% for the Investor Class and net expense ratio is 0.45% for the Institutional Class and 0.55% for the Investor Class.
Periods greater than one year are annualized. FPA New Income Fund (“Fund”) performance reflects the Institutional Class and is calculated on a total return basis which includes reinvestment of all distributions and is net of all fees and expenses. Fund returns do not reflect the deduction of taxes that a shareholder would pay on Fund distributions or the redemption of Fund shares, which would lower these figures. Comparison to any index is for illustrative purposes only. The Fund does not include outperformance of any index or benchmark in its investment objectives. An investor cannot invest directly in an index.
The Fund’s Total Annual Fund Operating Expenses before reimbursement (as of the most recent prospectus) is 0.59% for the Institutional Class and 0.77% for the Investor Class. First Pacific Advisors, LP (“FPA” or the “Adviser”) has contractually agreed to reimburse the Fund for Total Annual Fund Operating Expenses (excluding interest, taxes, brokerage fees and commissions payable by the Fund in connection with the purchase or sale of portfolio securities, and extraordinary expenses, including litigation expenses not incurred in the Fund’s ordinary course of business) in excess of 0.454% of the average daily net assets of the Institutional Class shares of the Fund through January 31, 2027, and in excess of 0.554% of the average daily net assets of the Investor Class shares of the Fund through January 31, 2027. This agreement may only be terminated earlier by the Fund’s Board of Trustees (the “Board”) or upon termination of the Advisory Agreement.
In addition, the Adviser has voluntarily agreed to waive the advisory fee it receives from the Fund by 0.046% through January 31, 2027 of the Fund’s average daily net assets. FPA will not seek recoupment of the advisory fees voluntarily waived.
Please see important disclosures at the end of this commentary.
Dear Shareholder:
FPA New Income Fund (the “Fund”) returned 0.17% in the first quarter of 2026.
| 3/31/2026 | |
|---|---|
| Yield-to-worst1 | 4.24% |
| Effective Duration | 3.33 Years |
| Spread Duration | 1.98 Years |
| High Quality Exposure2 | 96% |
| Credit Exposure3 | 4% |
¹ As of March 31, 2026, the Fund’s subsidized/unsubsidized 30-day SEC standardized yield (“SEC Yield”) was 3.45%/3.32% respectively. The SEC Yield calculation is an annualized measure of the Fund’s dividend and interest payments for the last 30 days, less the Fund expenses. Subsidized yield reflects fee waivers and/or expense reimbursements during the period. Without waivers and/or reimbursements, yields would be reduced. Unsubsidized yield does not adjust for any fee waivers and/or expense reimbursements in effect. The SEC Yield calculation shows investors what they would earn in yield over the course of a 12-month period if the fund continued earning the same rate for the rest of the year.
Yield-to-worst (“YTW”) is presented gross of fees and reflects the lowest potential yield that can be received on a debt investment without the issuer defaulting. YTW considers the impact of expected prepayments, calls and/or sinking funds, among other things. Average YTW is based on the weighted average YTW of the investments held in the Fund’s portfolio. YTW may not represent the yield an investor should expect to receive.
2 High Quality is defined as investments rated A or higher, Treasuries, and cash and equivalents.
3 Credit is defined as investments rated BBB or lower, including non-rated investments.
Prior to February 28, 2026, the bond market expected 60 bps of cuts to the Fed Funds rate over the remainder of 2026. On February 28, 2026, the United States attacked Iran. The ensuing war has triggered shortages and price increases for oil and other commodities, reflecting the Gulf region’s large share of global supply. Since the commencement of hostilities, Treasury yields have been volatile. Yields initially increased as the bond market shifted its focus to inflation and, consequently, expected fewer cuts to the Fed Funds rate this year. News suggesting a longer conflict drove rates higher, and suggestions of a near-term conclusion to the war drove rates lower. Treasury yields decreased toward the end of the quarter on the possibility of rate cuts amid concerns that inflation could lead to lower economic growth due to demand destruction. Through February 28, yields on one- to five-year maturity Treasuries had decreased by zero to 22 basis points. After February 28, yields on those same maturities rose 20 to 46 basis points, which resulted in a total increase in the quarter of 21 to 35 basis points. Spreads on investment grade bonds did not change meaningfully during the quarter while spreads on high yield bonds and leveraged loans increased by approximately 50 bps from low levels at the beginning of the quarter. Much of the increase in high yield bond and loan spreads occurred in the weeks prior to the war with a notable contribution from an increase in spreads on software-related debt. We seek to opportunistically invest in Credit (investments rated BBB or lower) when we believe prices adequately compensate for the risk of permanent impairment of capital and near-term mark-to-market risk. Though higher spreads mean that Credit is relatively cheaper than it was a few months ago, on an absolute basis we did not generally view Credit as attractively priced during the quarter. Because of low spreads, we invested in longer-duration, High Quality bonds (rated single-A or higher) that we believe will enhance both the Fund’s long-term returns and short-term upside-versus-downside return profile. The Fund’s Credit exposure was 3.3% on March 31, 2026 versus 3.6% on December 31, 2025. Cash and equivalents represented 6.2% of the portfolio on March 31, 2026 versus 9.1% on December 31, 2025.
1Q 2026 Top and Bottom Contributors4
| ▲ Top contributors | Notable drivers of return |
|---|---|
| Agency mortgage pools | Interest income and amortization of principal, partially offset by price declines caused by an increase in benchmark yields |
| Cash and equivalents | Interest income |
| Equipment ABS | Interest income, partially offset by price declines caused by an increase in benchmark yields |
| ▼ Bottom contributors | Notable drivers of return |
|---|---|
| Treasuries | Price decrease caused by an increase in benchmark yields, partially offset by interest income |
| Recurring revenue loan ABS | Price decrease driven by an increase in spreads, partially offset by interest income and amortization of principal |
| Non-agency CMBS | Price decrease caused by an increase in benchmark yields and spreads, partially offset by interest income |
4 It should not be assumed that an investment in the securities mentioned was or will be profitable. The Fund’s full list of holdings as of March 31, 2026 can be found at https://fpa.com/wp-content/uploads/FPA-New-Income-Fund-Holdings-2026-03.pdf. The information provided does not reflect all positions purchased, sold or recommended by FPA during the quarter.
Portfolio Activity5
The tables below provide an overview of the portfolio as of March 31, 2026 and December 31, 2025:
| 3/31/2026 | 12/31/2025 | ||
|---|---|---|---|
| Yield-to-worst6 | 4.24% | 4.00% | |
| Effective Duration | 3.33 years | 3.22 years | |
| Spread Duration | 1.98 years | 2.30 years | |
| Average Life | 3.74 years | 3.59 years |
| 3/31/2026 | 12/31/2025 | ||
|---|---|---|---|
| Sector Exposure (% of portfolio) | |||
| ABS | 22.4 | 24.1 | |
| CLO | 2.8 | 3.0 | |
| Corporate | 3.2 | 3.4 | |
| Agency CMBS | 11.5 | 11.9 | |
| Non-Agency CMBS | 2.4 | 2.5 | |
| Agency RMBS | 16.3 | 21.3 | |
| Non-Agency RMBS | 5.8 | 6.1 | |
| Stripped Mortgage-backed | 0.2 | 0.3 | |
| U.S. Treasury | 29.1 | 18.4 | |
| Cash and equivalents | 6.2 | 9.1 | |
| Total | 100.0 | 100.0 |
5 Portfolio composition will change due to ongoing management of the Fund.
6 As of March 31, 2026, the Fund’s subsidized/unsubsidized 30-day SEC standardized yield (“SEC Yield”) was 3.45%/3.32% respectively. The SEC Yield calculation is an annualized measure of the Fund’s dividend and interest payments for the last 30 days, less the Fund expenses. Subsidized yield reflects fee waivers and/or expense reimbursements during the period. Without waivers and/or reimbursements, yields would be reduced. Unsubsidized yield does not adjust for any fee waivers and/or expense reimbursements in effect. The SEC Yield calculation shows investors what they would earn in yield over the course of a 12-month period if the Fund continued earning the same rate for the rest of the year.
Yield-to-worst (“YTW”) is presented gross of fees and reflects the lowest potential yield that can be received on a debt investment without the issuer defaulting. YTW considers the impact of expected prepayments, calls and/or sinking funds, among other things. Average YTW is based on the weighted average YTW of the investments held in the Fund’s portfolio. YTW may not represent the yield an investor should expect to receive.
Past performance is no guarantee, nor is it indicative, of future results.
In general, and as described in more detail below, spreads on investment grade and high yield-rated debt remain low. Yet not all debt is created equal. Some debt has more credit risk and/or worse liquidity compared to other debt that is less risky or “risk-free,” like Treasuries. Spread measures the extra yield that compensates buyers of debt for taking on incremental credit risk and/or worse liquidity compared to debt that has less credit risk and/or better liquidity. Debt with more credit risk and/or worse liquidity tends to – and should have – more spread. When spreads are low, as they are now, riskier debt does not offer enough extra return for the extra risk. Further, we believe that low spreads increase the odds and severity of short-term drawdowns associated with an increase in spreads. Consequently, in today’s low spread environment, our investment activity has skewed toward High Quality bonds that we believe offer better liquidity and can mitigate drawdowns that might occur were spreads to increase. Specifically, within the High Quality universe, we have been buying longer-duration bonds that we believe will improve the long-term return potential of the portfolio and improve the portfolio’s short-term upside-versus-downside return.
Below is a summary of our investment activity during the quarter:
- Extended the duration of our existing Treasury holdings.
- Sold agency mortgage pools with a weighted average life and duration of 4.1 years and 3.9 years, respectively, at unattractively low spreads and reinvested the proceeds into Treasuries with a weighted average duration of 4.4 years, thereby slightly increasing the interest rate duration of that capital while shedding spread-related duration risk.
- Sold High Quality ABS which had a weighted average life and duration of 1.5 years and 1.4 years, respectively, and reinvested the proceeds into Treasuries with a duration of 4.5 years.
- Bought High Quality bonds with a weighted average life and duration of 4.9 years and 4.4 years, respectively, including:
- Treasuries (an addition to the Treasury investments described above)
- Agency mortgage pools
- Agency collateralized mortgage obligations (CMO)
- Asset-backed securities (ABS) backed by equipment
- Utility cost recovery or rate reduction bonds (included within ABS holdings)
- ABS backed by prime auto loans
We did not make any Credit investments during the quarter.
Observations
In the weeks prior to February 28, 2026, Treasury yields declined because the market expected the Federal Reserve to cut the Fed Funds rate over the course of 2026. The United States’ attack on Iran on February 28 caused a recalibration of those expectations as the market turned its focus to inflation, because most immediately the attacks and related closure of the Strait of Hormuz left a significant portion of global oil production stranded in the Persian Gulf. Further, the closure of the Strait of Hormuz and Iran’s related attacks on both oil facilities and sources of other global commodities (aluminum, natural gas, helium, fertilizer, etc.) in the region drove expectations of higher prices on a broad range of goods around the world ranging from plastics to crops to semiconductors. Before the war, the market expected easier monetary policy in the wake of lower inflation and potential weakness in unemployment, but post-war the market expected tighter monetary policy to combat the potential inflationary impact of the conflict.
The shorter the conflict, the more likely supply might be quickly reinstated and higher prices prove temporary. Thus, since February 28, headlines suggesting a shorter conflict tended to drive rates lower while headlines suggesting a prolonged conflict tended to drive rates higher. By the end of the quarter, a month into the conflict, concerns began to mount that higher prices could lead to demand destruction – a negative for economic growth – and lower rates.
The chart below shows the expectations for the Fed Funds rate over the past three months as expectations shifted from looser to tighter monetary policy.
Cumulative change in Fed Funds Rate expected through December 2026
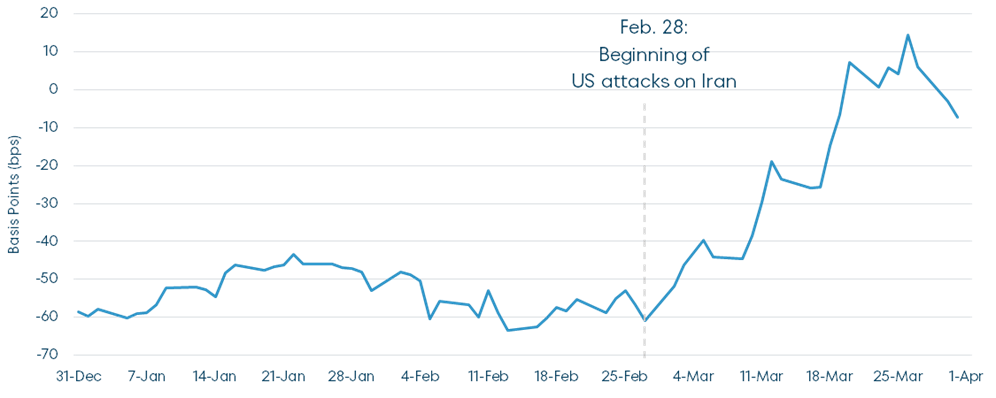
Source: Bloomberg. Data from 12/31/2025-3/31/2026. Past performance is no guarantee, nor is it indicative, of future results. Please refer to the end of the commentary for Important Disclosures and Index definitions.
Driven by these changing expectations, benchmark Treasury yields decreased during the first two months of the quarter, then increased over the course of March:
U.S. Treasury Yield Curve
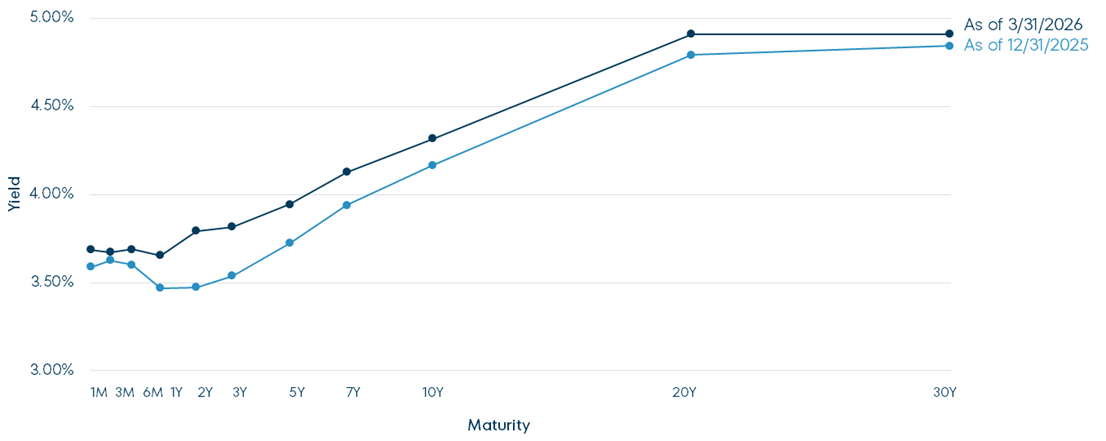
Maturity
| Change in yield (bps) | 1Y | 2Y | 3Y | 5Y | 7Y | 10Y | 20Y | 30Y |
|---|---|---|---|---|---|---|---|---|
| 12/31/25 to 2/28/26 | 0 | -10 | -16 | -22 | -24 | -23 | -24 | -23 |
| 2/28/26 to 3/31/26 | 18 | 42 | 44 | 44 | 43 | 38 | 36 | 30 |
| Q1 2026 | 19 | 32 | 28 | 22 | 19 | 15 | 12 | 7 |
Source: Bloomberg; As of March 31, 2026. Past performance is no guarantee, nor is it indicative, of future results. Please refer to the end of the commentary for Important Disclosures and definitions of key terms.
Meanwhile, the war appears to have had very little impact on investment grade bond spreads. As shown below, those spreads have not changed meaningfully over the past three months. Moreover, there has been very little difference in spreads pre- and post-war.
Bloomberg U.S. Aggregate Bond Index
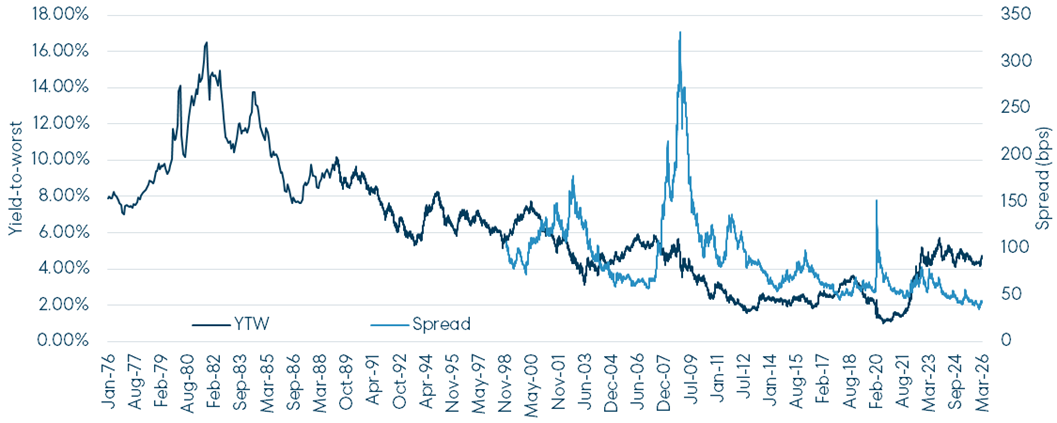
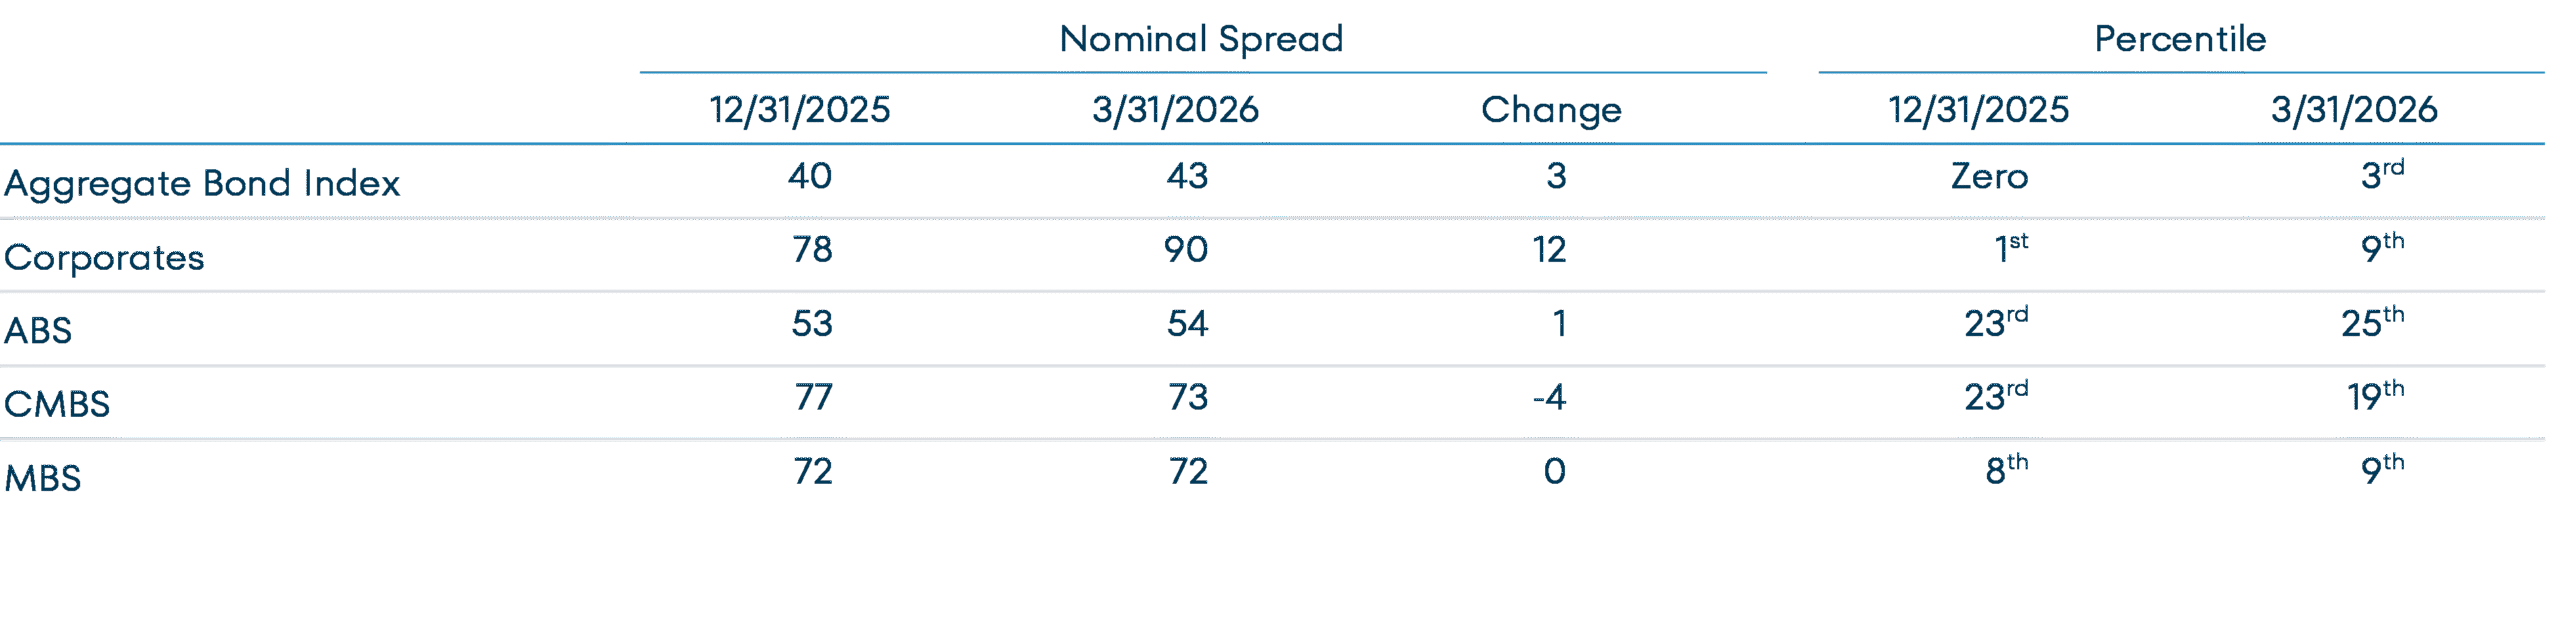
Source: Bloomberg. As of March 31, 2026. YTW is Yield-to-Worst. Spread reflects the quoted spread of a bond that is relative to the security off which it is priced, typically an on the run treasury. Past performance is no guarantee, nor is it indicative, of future results. Please refer to the end of the commentary for Important Disclosures and Index definitions.
Spreads in the high yield and leveraged loan markets increased overall, but not significantly. A substantial portion of the increase at the index level was driven by an increase in spreads on software companies’ debt, which traded at higher spreads not because of fears of war but rather fears of artificial intelligence decimating those companies’ business models. Data on the high yield market is shown below for reference. In the leveraged loan market, spreads on software debt increased by 232 bps during the quarter and – owing to a 14% weight in the leveraged loan index – drove a 51 bps increase in the leveraged loan index spread.7
7 Source: JPMorgan
Bloomberg U.S. Corporate High Yield Index
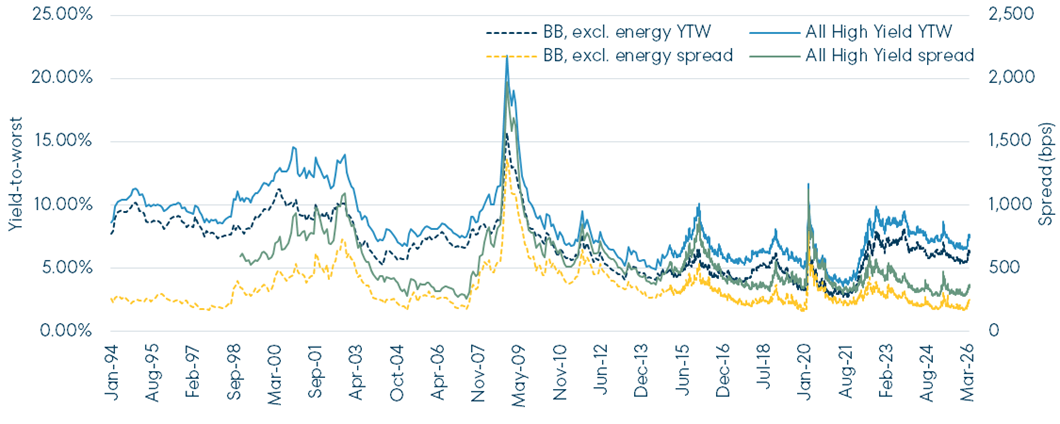
Source: Bloomberg and JPMorgan. As of March 31, 2026. *Services and software (technology) represented 4.7%, on average, of the JPM High Yield Index in Q1 2026. YTW is Yield-to-Worst. Spread reflects the quoted spread of a bond that is relative to the security off which it is priced, typically an on-the-run Treasury. Past performance is no guarantee, nor is it indicative, of future results. Please refer to the end of the commentary for Important Disclosures and Index definitions.
The capabilities of artificial intelligence are progressing rapidly. Some software companies may become casualties of this new technology. The fear that every software company and any company peripherally related to software will become obsolete may create attractive investment opportunities at some point. With very little software exposure in the portfolio, we have ample room to take advantage of those opportunities should they arise. In the meantime, looking at the rest of the market, we do not consider the increase in high yield and loan spreads to be meaningful, especially given the very low starting point at the beginning of the quarter. In other words, that the market is cheaper is a relative statement. In our eyes, the market has gone from very expensive to less expensive – but it’s still expensive.
In the absence of compelling investment opportunities in BBB or lower-rated debt, we have been investing in longer duration, highly rated bonds with a focus on the highest-quality bonds we expect to remain relatively liquid during market dislocations. There are esoteric bonds, issuers, and asset classes that trade at slightly higher spreads, but we typically find that the extra return we could earn on those investments does not adequately compensate for their questionable credit quality and/or illiquidity. We are not categorically ruling out those types of investments; rather, they are not appealing at the present time. We have learned that such esoteric investments tend to get cheaper faster during market downturns, compared to more “plain vanilla” investments. In a downturn, we believe we will be able to avoid the larger drawdown that these esoteric investments may incur and then avail ourselves of attractive investment opportunities that arise. Until then, because the incremental spread on these esoteric investments compared to plain vanilla investments is relatively low, we do not believe we are giving up much return while we wait. In other words, we believe the opportunity cost of owning very high quality, liquid bonds is low.
Even though the Fund’s holdings in aggregate are of much higher quality than other comparable funds or indices, owning less credit risk these days does not cause us consternation, because spreads are historically expensive. Yet valuing credit risk is just one part of our investment process. In addition to assessing risk versus reward in underwriting credit risk, we must also assess risk versus reward with respect to interest rate duration. Duration can be a means to make macroeconomic bets, and fixed income investors have been conditioned to expect returns to rely on macroeconomic bets. Thus, our conversations with investors about fixed income invariably include questions about the economy and the future direction of interest rates. We are not in the forecasting business because that’s a difficult way to make money. As such, our response to questions about the economy and the future direction of interest rates is typically “we don’t know”. The war is a good example of why we take that position. Much like the macroeconomy, the outcome of the war is very difficult to predict. And whatever one’s views are, there is a difference between what one thinks should happen and what will happen. Trying to predict the war’s outcome, the timing, the second and third order effects like demand destruction, geopolitical impacts that affect the demand for U.S. assets, fiscal impacts, etc. is a tall order. It’s a long list of unknowns and the size of that list itself is unknown. If one were to bet on higher rates by owning short-duration bonds – which could amount to a bet on a longer conflict – and rates then decreased, high single digit positive returns are potentially lost near-term. Alternatively, if one were to bet on lower rates by owning longer duration bonds – which could amount to a bet on a shorter conflict – and rates then increased, short-term losses are possible.
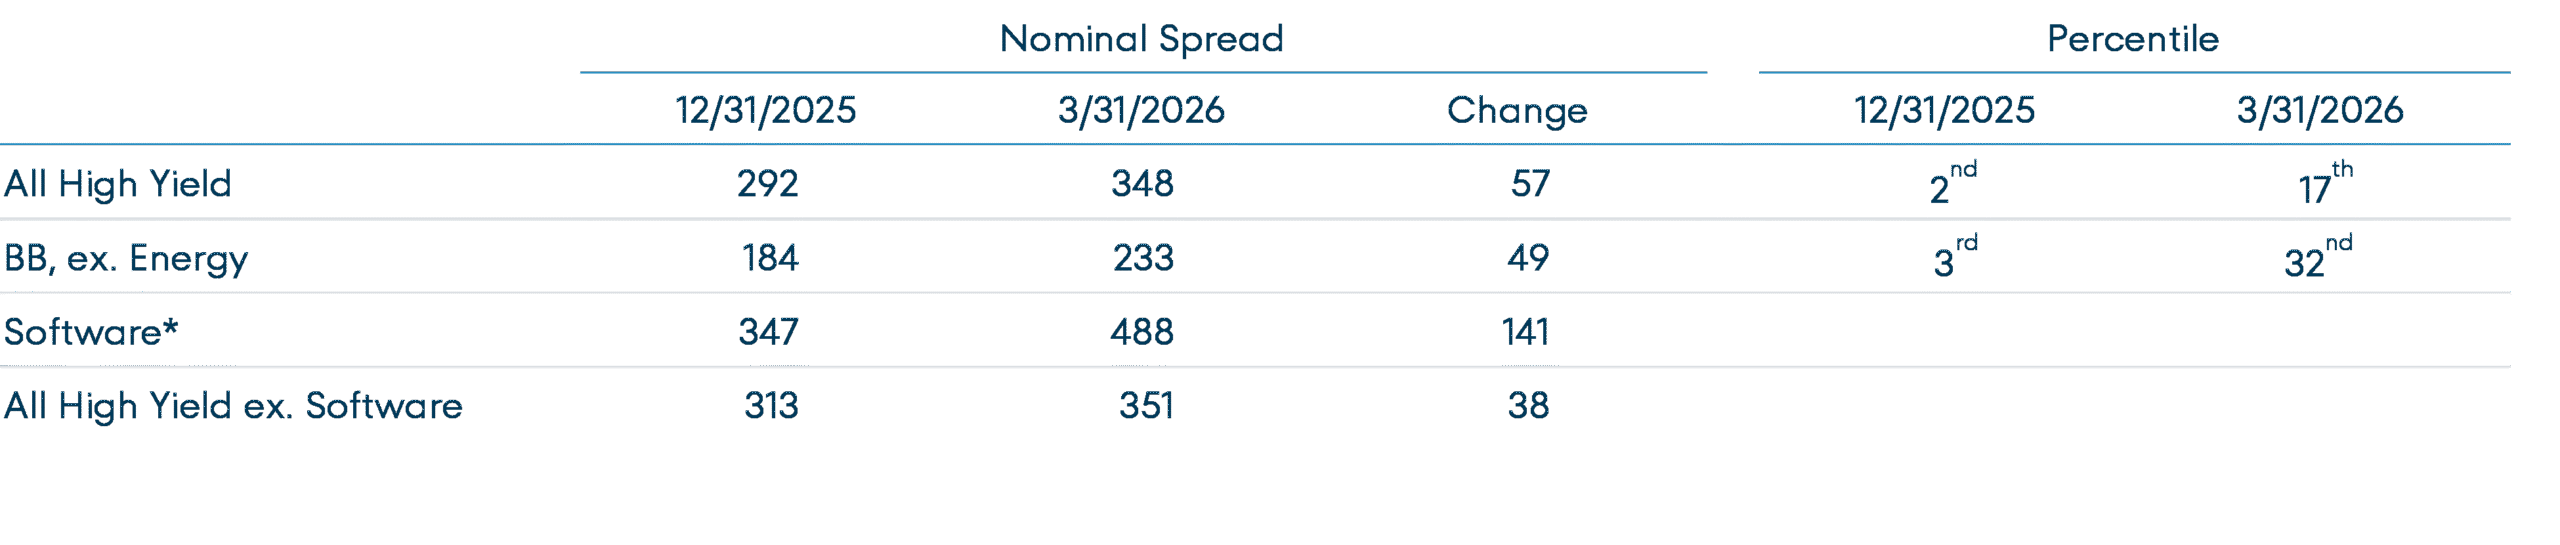
There is little clarity with respect to the outcome of the war and the impact on rates. Rather than make directional bets that can create short-term asymmetric upside versus downside, we seek a better balance between upside versus downside that we believe allows us to meaningfully participate in the returns created by a decrease in rates while mitigating the drawdown associated with an increase in rates. Our 100 bps duration test attempts to achieve this balance by identifying the longest-duration bonds that we expect will produce at least a breakeven return over a 12-month period, assuming a bond’s yield will increase by 100 bps during that period. The chart below illustrates our duration test.
Hypothetical 12-Month U.S. Treasury Returns
As of March 31, 2026. Source: Bloomberg. ^ Yield-to-maturity is the annualized total return anticipated on a bond if the bond is held until it matures and assumes all payments are made as scheduled and are reinvested at the same yield. * Downside return estimates the 12-month total return assuming yields increase by 100 bps over 12 months. Upside return estimates the 12-month total return assuming yields decline by 100 bps over 12 months. Return estimates assume gradual change in yield over 12 months. The hypothetical stress test data provided herein is for illustrative and informational purposes only and is intended to demonstrate the mathematical impact of a hypothetical change in Treasury yields on Treasury returns. This data is not, and is not intended to be representative of the Fund’s returns. No representation is being made that any account, product or strategy will or is likely to achieve profits, losses, or results similar to those shown. Past performance is no guarantee, nor is it indicative, of future results. Please refer to the back of the commentary for important disclosures.
The dark blue bars above show Treasury yields of various maturities as of March 31, 2026. The light blue bars show the results of our duration test and represent the potential short-term downside return for these bonds in a rising interest rate environment. For example, the 5-year Treasury purchased at a 3.94% yield was expected to return 0.35% over twelve months if its yield increased by 100 bps from 3.94% to 4.94% during that time. Because the expected short-term downside return was positive, the 5-year Treasury and other bonds with a similar duration were candidates for our portfolio. The 7-year Treasury was not a candidate for our portfolio at that time because it produced an expected short-term loss. The yellow bars on the chart above indicate the short-term upside return potential over twelve months if rates decreased by 100 bps. In the example above, the 5-year Treasury offered a potential 12-month total return of 7.69%.
We use our 100 bps test to guide us in choosing the duration of our investments. We are attempting to build into each of our investments the ability to mitigate short-term drawdowns should interest rates rise because of higher inflation, stronger economic growth, loss of Federal Reserve independence, geopolitics-induced capital flight from the U.S., or fiscal concerns, for example. On the other hand, the longer duration investments identified by our test could allow us to participate in a significant portion of the return that longer duration indices like the Aggregate Bond Index might produce if lower rates prevail because of weaker economic growth, increased productivity, disinflation, preservation of Federal Reserve independence, or geopolitical calm, for example.
Over the past several weeks, war-related headlines have introduced increased volatility into the rates market. Despite the U.S. and the world facing different prospects than they faced before February 28, spreads have not changed meaningfully. We operate with the knowledge that debt markets are episodic – long periods of unattractiveness are interspersed with periods of attractiveness. Low spreads make the market for credit risk unattractive at the moment. We are patient, long-term oriented investors who are well-suited to deal with such unattractiveness. We will strive to avoid the temptation to take on uncompensated credit risk while, as always, opportunistically taking advantage of opportunities that may arise. Until those opportunities arise, we’ll take the advice of Calvin Broadus Jr. and “just chill ‘til the next episode.”8
8 By “chill” we mean wait.
Thank you for your confidence and continued support.
Abhijeet Patwardhan
Portfolio Manager
April 2026
Important Information
This Commentary is for informational and discussion purposes only and does not constitute, and should not be construed as, an offer or solicitation for the purchase or sale of any securities, products or services discussed, and neither does it provide investment advice. Any such offer or solicitation shall only be made pursuant to the Fund’s Prospectus, which supersedes the information contained herein in its entirety.
The views expressed herein and any forward-looking statements are as of the date of the publication and are those of the portfolio management team. Future events or results may vary significantly from those expressed and are subject to change at any time in response to changing circumstances and industry developments. This information and data has been prepared from sources believed reliable, but the accuracy and completeness of the information cannot be guaranteed and is not a complete summary or statement of all available data. You should not construe the contents of this document as legal, tax, accounting, investment or other advice or recommendations.
Portfolio composition will change due to ongoing management of the Fund. References to individual securities or sectors are for informational purposes only and should not be construed as recommendations by the Fund, the portfolio manager, the Adviser, or the distributor. It should not be assumed that future investments will be profitable or will equal the performance of the security or sector examples discussed. The portfolio holdings as of the most recent quarter-end may be obtained at fpa.com.
The statements made herein may be forward-looking and/or based on current expectations, projections, and/or information currently available. Actual results may differ from those anticipated. The portfolio manager and/or FPA cannot assure future results and disclaims any obligation to update or alter any statistical data and/or references thereto, as well as any forward-looking statements, whether as a result of new information, future events, or otherwise. Such statements may or may not be accurate over the long-term.
Investments carry risks and investors may lose principal value. Capital markets are volatile and can decline significantly in response to adverse issuer, political, regulatory, market, or economic developments. The Fund may purchase foreign securities, including depository receipts, which are subject to interest rate, currency exchange rate, economic and political risks; these risks may be elevated when investing in emerging markets. Foreign investments, especially those of companies in emerging markets, can be riskier, less liquid, harder to value, and more volatile than investments in the United States. The securities of smaller, less well-known companies can be more volatile than those of larger companies.
The return of principal in a bond fund is not guaranteed. Bond funds have the same issuer, interest rate, inflation and credit risks that are associated with underlying bonds owned by the Fund. Lower rated bonds, convertible securities and other types of debt obligations involve greater risks than higher rated bonds.
Interest rate risk is the risk that when interest rates go up, the value of fixed income instruments, such as bonds, typically go down and investors may lose principal value. Credit risk is the risk of loss of principal due to the issuer’s failure to repay a loan. Generally, the lower the quality rating of a fixed income instrument, the greater the risk that the issuer will fail to pay interest fully and return principal in a timely manner. If an issuer defaults, the fixed income instrument may lose some or all of its value.
Mortgage securities and collateralized mortgage obligations (CMOs) are subject to prepayment risk and the risk of default on the underlying mortgages or other assets; such derivatives may increase volatility. Convertible securities are generally not investment grade and are subject to greater credit risk than higher-rated investments. High yield securities can be volatile and subject to much higher instances of default.
Collateralized debt obligations (“CDOs”), which include collateralized loan obligations (“CLOs”), collateralized bond obligations (“CBOs”), and other similarly structured securities, carry additional risks in addition to interest rate risk and default risk. This includes, but is not limited to: (i) distributions from the underlying collateral may not be adequate to make interest or other payments; (ii) the quality of the collateral may decline in value or default; and (iii) the complex structure of the security may not be fully understood at the time of investment and may produce disputes with the issuer or unexpected investment results. Investments in CDOs are also more difficult to value than other investments.
Value style investing presents the risk that the holdings or securities may never reach their full market value because the market fails to recognize what the portfolio management team considers the true business value or because the portfolio management team has misjudged those values. In addition, value style investing may fall out of favor and underperform growth or other styles of investing during given periods.
The ratings agencies that provide ratings are Standard and Poor’s (“S&P”), Fitch, Moody’s, Kroll, DBRS, and any other nationally recognized statistical rating organization (“NRSRO”). Credit ratings range from AAA (highest) to D (lowest). Bonds rated BBB or above are considered investment grade. Credit ratings of BB and below are lower-rated securities (junk bonds). High-yielding, non-investment grade bonds (junk bonds) involve higher risks than investment grade bonds. Bonds with credit ratings of CCC/Caa or below have high default risk. Please refer to the Fund’s Prospectus for a complete overview of the primary risks associated with the Fund.
The Fund is not authorized for distribution unless preceded or accompanied by a current prospectus. The prospectus can be accessed at: https://fpa.com/resources.
Hypothetical Stress-Tested Results
The hypothetical and estimated data provided herein is for illustrative and informational purposes only. No representation is being made that Fund or the securities used for the simulation will or is likely to achieve profits, losses, or results similar to those shown. Hypothetical and estimated results do not reflect trading in actual accounts, and do not reflect the impact that economic, market or other factors may have on the management of the account.
The hypothetical and estimated results as set forth in this commentary do not represent actual results; actual results may significantly differ from the theoretical data being presented. Hypothetical/estimated results have certain inherent limitations. Hypothetical models theoretically may be changed from time to time to obtain more favorable results. There may be sharp differences between simulated or estimated results and the actual results subsequently achieved by any particular security, account, product or strategy. In addition, simulated/estimated results cannot account for the impact of certain market risks such as a lack of liquidity or default risk. There are numerous other factors related to the markets in general or the implementation of any specific strategy which cannot be fully accounted for in the preparation of simulated or estimated results, all of which can adversely affect actual results.
A client’s individual portfolio results may vary from any hypothetical or estimated results because of the timing of trades, deposits and withdrawals, the impact of management fees and taxes, market fluctuations, trading costs, cash flows, custodian fees, among other factors. Hypothetical results are not meant to be construed as a prediction of the future return of the Fund. Past performance is no guarantee, nor is it indicative, of future results.
Index Definitions
Comparison to any index is for illustrative purposes only and should not be relied upon as a fully accurate measure of comparison. The Fund will be less diversified than the indices noted herein and may hold non-index securities or securities that are not comparable to those contained in an index. Indices will hold positions that are not within the Fund’s investment strategy. Indices are unmanaged, do not reflect any commissions, fees or expenses which would be incurred by an investor purchasing the underlying securities. The Fund does not include outperformance of any index or benchmark in its investment objectives. Investors cannot invest directly in an index
Bloomberg U.S. Aggregate Bond Index provides a measure of the performance of the U.S. investment grade bonds market, which includes investment grade U.S. Government bonds, investment grade corporate bonds, mortgage pass-through securities and asset-backed securities that are publicly offered for sale in the United States. The securities in the Index must have at least 1 year remaining in maturity. In addition, the securities must be denominated in U.S. dollars and must be fixed rate, nonconvertible, and taxable.
Bloomberg U.S. Aggregate 1-3 Year Bond Index provides a measure of the performance of the U.S. investment grade bonds market, which includes investment grade U.S. Government bonds, investment grade corporate bonds, mortgage pass-through securities and asset-backed securities that are publicly offered for sale in the United States. The securities in the Index must have a remaining maturity of 1 to 3 years. In addition, the securities must be denominated in U.S. dollars and must be fixed rate, nonconvertible, and taxable.
Bloomberg U.S. Corporate High Yield Bond Index measures the market of USD-denominated, non-investment grade, fixed-rate, taxable corporate bonds.
Bloomberg U.S. Investment Grade Corporate Index measures the investment grade, fixed-rate, taxable corporate bond market. It includes USD denominated securities publicly issued by US and non-US industrial, utility, and financial issuers.
Consumer Price Index (CPI) is an unmanaged index representing the rate of the inflation of the U.S. consumer prices as determined by the U.S. Department of Labor Statistics. This index reflects non-seasonally adjusted returns. There can be no guarantee that the CPI or other indexes will reflect the exact level of inflation at any given time.
CPI +100 Basis Points is created by adding 1% to the annual percentage change in the Consumer Price Index (“CPI”).
Merrill Lynch Option Volatility Estimate (MOVE) Index reflects the level of volatility in U.S. Treasury futures. The index is considered a proxy for term premiums of U.S. Treasury bonds (i.e., the yield spread between long-term and short-term bonds).
Morningstar Short-Term Bond portfolios invest primarily in corporate and other investment-grade U.S. fixed-income issues and typically have durations of 1.0 to 3.5 years. These portfolios are attractive to fairly conservative investors, because they are less sensitive to interest rates than portfolios with longer durations. Morningstar calculates monthly breakpoints using the effective duration of the Morningstar Core Bond Index in determining duration assignment. Short-term is defined as 25% to 75% of the three-year average effective duration of the MCBI. As of March 31, 2026, there were 554 funds in the category.
Glossary of Terms
ABS (Asset Backed Securities) are financial securities backed by a loan, lease or receivables against assets other than real estate and mortgage-backed securities.
Average Life (years) is the average length of time that each dollar of unpaid principal on a loan, a mortgage or an amortizing bond remains outstanding.
Basis Point (bps) is equal to one hundredth of one percent, or 0.01%. 100 basis points = 1%.
CLO (Collateralized Loan Obligation) is a single security backed by a pool of debt.
CMBS (Commercial Mortgage Backed Security) is a mortgage-backed security backed by commercial mortgages rather than residential mortgages.
Credit is defined as investments rated BBB or lower, including non-rated investments.
Effective Duration measures the sensitivity of the price to changes in interest rates, incorporating the impact of changes in interest rates on call options and expected cashflows. Calculations for the Fund exclude equity holdings.
A fixed rate bond is a bond that pays the same level of interest over its entire term.
Floating-rate security, also known as a “floater”, is an investment with interest payments that float or adjust periodically based upon a predetermined benchmark.
High Quality is defined as investments rated A or higher, Treasuries, and cash and equivalents.
On-the-run Treasuries are the most recently issued U.S. Treasury bonds, notes, or bills of a specific maturity and can serve as benchmarks for pricing other financial instruments.
Risk-free rate of return is the theoretical rate of return of an investment with zero risk. The risk-free rate represents the interest an investor would expect from an absolutely risk-free investment over a specified period of time.
RMBS (Residential Mortgage Backed Securities) are mortgage-backed securities backed by residential mortgages.
Spread Duration is the sensitivity of the price of a security to changes in its credit spread. The credit spread is the difference between the yield of a security and the yield of a benchmark rate, such as a cash interest rate or government bond yield. Calculations for the Fund exclude equity holdings.
©2026 Morningstar, Inc. All Rights Reserved. The information contained herein: (1) is proprietary to Morningstar and/or its content providers; (2) may not be copied or distributed; and (3) is not warranted by Morningstar to be accurate, complete or timely. Neither Morningstar nor its content providers are responsible for any damages or losses arising from any use of this information. Past performance is no guarantee of future results.
The FPA Funds are distributed by Distribution Services, LLC. 190 Middle Street, Suite 301, Portland, ME 04101. Distribution Services, LLC and FPA are not affiliated.