
You should consider the Fund’s investment objectives, risks, and charges and expenses carefully before you invest. The Prospectus details the Fund’s objective and policies, charges, and other matters of interest to a prospective investor. Please read the Prospectus carefully before investing. The Prospectus may be obtained by visiting the website at fpa.com, by email at [email protected], toll-free by calling 1-800-982-4372 or by contacting the Fund in writing.
Average Annual Total Returns (%)
| As of September 30, 2025 | 40 Yr | 30 Yr | 20 Yr | 15 Yr | 10 Yr | 5 Yr | 3 Yr | 1 Yr | YTD | QTD |
|---|---|---|---|---|---|---|---|---|---|---|
| FPA New Income (FPNIX) | 5.64 | 4.01 | 2.90 | 2.42 | 2.88 | 3.23 | 6.29 | 5.00 | 6.15 | 1.76 |
| Bloomberg U.S. Aggregate | 5.71 | 4.32 | 3.23 | 2.26 | 1.84 | -0.45 | 4.93 | 2.88 | 6.13 | 2.03 |
| CPI + 100 | 3.82 | 3.56 | 3.51 | 3.71 | 4.20 | 5.57 | 4.08 | 4.06 | 2.90 | 1.14 |
| Bloomberg U.S. Aggregate 1-3 Yr | N/A | N/A | 2.43 | 1.65 | 1.92 | 1.78 | 4.71 | 4.14 | 4.16 | 1.20 |
Index data source: Morningstar.
Past performance is no guarantee of future results and current performance may be higher or lower than the performance shown. This data represents past performance and investors should understand that investment returns and principal values fluctuate, so that when you redeem your investment it may be worth more or less than its original cost. Current month-end performance data, which may be higher or lower than the performance data quoted, may be obtained at fpa.com or by calling toll-free, 1-800-982-4372. As of its most recent prospectus, the Fund’s total expense ratio is 0.58% for the Institutional Class and 0.78% for the Investor Class and net expense ratio is 0.45% for the Institutional Class and 0.55% for the Investor Class.
Periods greater than one year are annualized. FPA New Income Fund (“Fund”) performance reflects the Institutional Class and is calculated on a total return basis which includes reinvestment of all distributions and is net of all fees and expenses. Fund returns do not reflect the deduction of taxes that a shareholder would pay on Fund distributions or the redemption of Fund shares, which would lower these figures. Comparison to any index is for illustrative purposes only. The Fund does not include outperformance of any index or benchmark in its investment objectives. An investor cannot invest directly in an index.
The Fund’s Total Annual Fund Operating Expenses before reimbursement (as of the most recent prospectus) is 0.58% for the Institutional Class and 0.78% for the Investor Class. First Pacific Advisors, LP (“FPA” or the “Adviser”) has contractually agreed to reimburse the Fund for Total Annual Fund Operating Expenses (excluding interest, taxes, brokerage fees and commissions payable by the Fund in connection with the purchase or sale of portfolio securities, and extraordinary expenses, including litigation expenses not incurred in the Fund’s ordinary course of business) in excess of 0.454% of the average daily net assets of the Institutional Class shares of the Fund through January 31, 2026, and in excess of 0.554% of the average daily net assets of the Investor Class shares of the Fund through January 31, 2026. This agreement may only be terminated earlier by the Fund’s Board of Trustees (the “Board”) or upon termination of the Advisory Agreement.
In addition, the Adviser has voluntarily agreed to waive the advisory fee it receives from the Fund by 0.046% through January 31, 2026 of the Fund’s average daily net assets. FPA will not seek recoupment of the advisory fees voluntarily waived.
Please see important disclosures at the end of this commentary.
Dear Shareholder:
FPA New Income Fund (the “Fund”) returned 1.76% in third quarter of 2025.
| 9/30/2025 | |
|---|---|
| Yield-to-worst1 | 4.14% |
| Effective Duration | 3.34 Years |
| Spread Duration | 2.53 Years |
| High Quality Exposure2 | 96% |
| Credit Exposure3 | 4% |
¹ As of September 30, 2025, the Fund’s subsidized/unsubsidized 30-day SEC standardized yield (“SEC Yield”) was 3.71%/3.57% respectively. The SEC Yield calculation is an annualized measure of the Fund’s dividend and interest payments for the last 30 days, less the Fund expenses. Subsidized yield reflects fee waivers and/or expense reimbursements during the period. Without waivers and/or reimbursements, yields would be reduced. Unsubsidized yield does not adjust for any fee waivers and/or expense reimbursements in effect. The SEC Yield calculation shows investors what they would earn in yield over the course of a 12-month period if the fund continued earning the same rate for the rest of the year.
Yield-to-worst (“YTW”) is presented gross of fees and reflects the lowest potential yield that can be received on a debt investment without the issuer defaulting. YTW considers the impact of expected prepayments, calls and/or sinking funds, among other things. Average YTW is based on the weighted average YTW of the investments held in the Fund’s portfolio. YTW may not represent the yield an investor should expect to receive.
2 High Quality is defined as investments rated A or higher, Treasuries, and cash and equivalents.
3 Credit is defined as investments rated BBB or lower, including non-rated investments.
During the third quarter of 2025, Federal Reserve Chair Jerome Powell characterized the U.S. economy as having two-sided risks: despite softening in the job market, inflation remained elevated. Against this backdrop, after leaving the Fed Funds rate unchanged on July 30, the Federal Reserve eased monetary policy on September 17 with a quarter-point rate cut and described its new policy stance as “modestly restrictive.” Following that rate cut, most Federal Reserve policymakers advocated for a cautious approach to further easing and expressed concern that inflation remains above the Fed’s 2% target.4 Treasury yields decreased during the quarter while spreads on investment grade and high yield debt continued to compress. Due to low spreads, we continued to focus on buying longer-duration, High Quality bonds (rated single-A or higher) we believe will enhance both the Fund’s long-term returns and short-term upside-versus-downside return profile. We seek to opportunistically invest in Credit when we believe prices adequately compensate for the risk of permanent impairment of capital and near-term mark-to-market risk; we did not generally view Credit (investments rated BBB or lower) as attractively priced during the quarter. The Fund’s Credit exposure was at 3.8% on September 30, 2025 versus 4.4% on June 30, 2025. Cash and equivalents represented 7.1% of the portfolio on September 30, 2025 versus 5.1% on June 30, 2025.
4 This cautious consensus was countered by newly-appointed Fed governor Stephen Miran’s lone dissenting view that interest rates should be lowered aggressively because current monetary policy is “well into restrictive territory.” Miran believes the neutral rate – the interest rate that is neither stimulating nor restricting economic growth – has been pushed significantly lower by recent non-monetary factors including shifts in border, tax, trade, and regulatory policies. See: https://www.federalreserve.gov/newsevents/speech/miran20250922a.htm.
Past performance is no guarantee, nor is it indicative, of future results.
3Q 2025 Contributors & Defractors5
| ▲ Top contributors | Notable drivers of performance |
|---|---|
| Agency mortgage pools | Price increase due to lower benchmark yields; interest income; and amortization of principal |
| Corporates | Common stock6 price appreciation, with some additional benefit from income and price appreciation of bonds an loans |
| Treasuries | Interest income and price increase due to lower benchmark yields |
| ▼ Bottom contributors |
|---|
| Although certain individual bonds detracted from performance during the quarter, there were no meaningful detractors at the sector level. |
⁵ This information is not a recommendation for a specific security or sector and these securities/sectors may not be in the Fund at the time you receive this report. The information provided does not reflect all positions purchased, sold or recommended by FPA during the quarter or calendar year. The portfolio holdings as of the most recent quarter-end may be obtained at fpa.com.
⁶ The common stock contribution to return was almost entirely due to price appreciation of PHI Group, Inc. common stock (“PHI”). PHI represented, on average, 1.1% of the portfolio during the quarter. Total common stock, including PHI and other common stock holdings, represented, on average, 1.7% of the portfolio during the quarter.
Portfolio Activity7
The table below shows the portfolio’s exposures as of September 30, 2025 and June 30, 2025:
| 9/30/2025 | 6/30/2025 | |
|---|---|---|
| Sector Exposure (% of portfolio) | ||
| ABS | 25.0 | 27.1 |
| CLO | 3.1 | 3.5 |
| Corporate | 3.6 | 4.1 |
| Agency CMBS | 12.4 | 13.9 |
| Non-Agency CMBS | 2.3 | 2.5 |
| Agency RMBS | 22.7 | 23.1 |
| Non-Agency RMBS | 6.4 | 6.7 |
| Stripped Mortgage-backed | 0.3 | 0.3 |
| U.S. Treasury | 17.1 | 13.7 |
| Cash and equivalents | 7.1 | 5.1 |
| Total | 100.0 | 100.0 |
| 9/30/2025 | 6/30/2025 | |
|---|---|---|
| Characteristics | ||
| Yield-to-worst8 | 4.14% | 4.43% |
| Effective Duration | 3.34 years | 3.34 years |
| Spread Duration | 2.53 years | 2.73 years |
| Average Life | 3.75 years | 3.78 years |
⁷ Portfolio composition will change due to ongoing management of the Fund.
⁸ As of September 30, 2025, the Fund’s subsidized/unsubsidized 30-day SEC standardized yield (“SEC Yield”) was 3.71%/3.57% respectively. The SEC Yield calculation is an annualized measure of the Fund’s dividend and interest payments for the last 30 days, less the Fund expenses. Subsidized yield reflects fee waivers and/or expense reimbursements during the period. Without waivers and/or reimbursements, yields would be reduced. Unsubsidized yield does not adjust for any fee waivers and/or expense reimbursements in effect. The SEC Yield calculation shows investors what they would earn in yield over the course of a 12-month period if the Fund continued earning the same rate for the rest of the year.
Yield-to-worst (“YTW”) is presented gross of fees and reflects the lowest potential yield that can be received on a debt investment without the issuer defaulting. YTW considers the impact of expected prepayments, calls and/or sinking funds, among other things. Average YTW is based on the weighted average YTW of the investments held in the Fund’s portfolio. YTW may not represent the yield an investor should expect to receive.
Past performance is no guarantee, nor is it indicative, of future results.
As we evaluated investment opportunities during the quarter, we looked for longer-duration bonds. Based on the yields available during the quarter, we believe longer-duration bonds will improve the long-term return potential of the portfolio and improve the portfolio’s short-term upside-versus-downside return. However, low spreads throughout fixed income markets led us to focus on higher quality bonds within the universe of longer duration investments. Low spreads increase the odds of incurring short-term drawdowns associated with an increase in spreads. We believe higher quality bonds will help mitigate drawdowns that might occur if spreads were to increase. To that end, during the quarter, in addition to extending the duration of our Treasury holdings, we bought fixed-rate, High Quality bonds with a weighted average life and duration of 5.1 years and 4.5 years, respectively. These High Quality bond investments included:
- Treasuries
- Agency mortgage pools
- Utility cost recovery bonds
- Agency collateralized mortgage obligations (CMO)
- Non-agency residential mortgage-backed securities (RMBS)
- Asset-backed securities (ABS) backed by equipment
- Non-agency commercial mortgage-backed securities (CMBS)
We sold High Quality ABS backed by recurring revenue loans with both a weighted average life and duration of 0.2 years.
We did not make any Credit investments during the quarter. Low spreads on lower-rated debt made it challenging to identify investments for the Fund that we believe offered sufficient compensation for short-term market-to-market risk and/or the possibility of a permanent impairment of capital.
Observations
Spurred by the Federal Reserve’s rate cuts during the quarter, rates declined over the past three months and are lower year -to-date:
U.S. Treasury Yield Curve
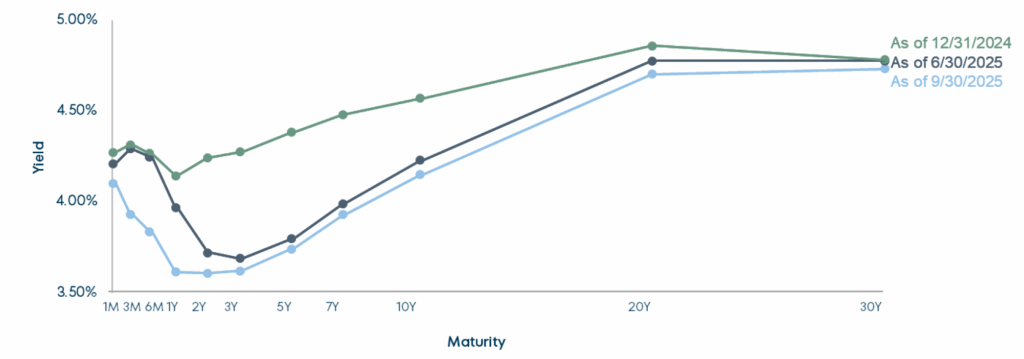
Maturity
| Change in yield (bps) | 1Y | 2Y | 3Y | 5Y | 7Y | 10Y | 20Y | 30Y |
|---|---|---|---|---|---|---|---|---|
| Q3 2025 | -35 | -11 | -7 | -6 | -6 | -8 | -7 | -4 |
| Year-to-date | -53 | -63 | -65 | -64 | -55 | -42 | -16 | -5 |
Source: Bloomberg; As of September 30, 2025. Please refer to the end of the commentary for Important Disclosures and definitions of key terms.
It is a good thing that we do not try to make money by betting on the direction of interest rates. A task that we had already viewed as nearly impossible to accomplish with conviction has become significantly more difficult in recent months. As of September 30, the market was expecting an additional 25–50 bps of rate cuts by the end of 2025. However, there is uncertainty about the timing and magnitude of those cuts because the Federal Reserve is wrestling with the conflicting objectives of keeping a lid on inflation — which is still running above the Fed’s 2% target — and guiding the economy toward full employment. If the choice were between managing inflation or employment, the path of rates would still be uncertain but less so. As it stands, the Federal Reserve must choose between easing too early and risking higher inflation or easing too late (or not at all) and risking increased unemployment and weaker growth. Adding to this challenge, the Federal Reserve is also wrestling with overt political pressure on monetary policy. Finally, the federal government is shut down and not producing data. If one assumes that the government produces good quality, reliable data, then it is difficult for central bankers (and, in turn, market forecasters) to know which way interest rates should move when data are not available.
The challenges noted above highlight why we believe speculating on future prices (or yields and spreads) is a risky way to make money. We’ve described just a few of the many factors that affect interest rates. In general, there are too many factors that might affect market prices or yields, and while it may be possible to have conviction in some factors, we believe it’s impossible to have enough conviction in enough factors to make an investment rather than a bet. On the other hand, we can have much more confidence when we use current market prices to guide our absolute return– and absolute value–based investment decisions.
For example, we do not use interest rate forecasts to guide our duration decisions. Instead, we use current market yields to guide our duration choices. Specifically, we use our 100 bps duration test to help us identify whether we are compensated for duration risk on an absolute basis. That test identifies the longest-duration bonds we expect will produce at least a breakeven return over a 12-month period, assuming a bond’s yield will increase by 100 bps during that period. The chart below illustrates our duration test.
Hypothetical 12-Month U.S. Treasury Returns
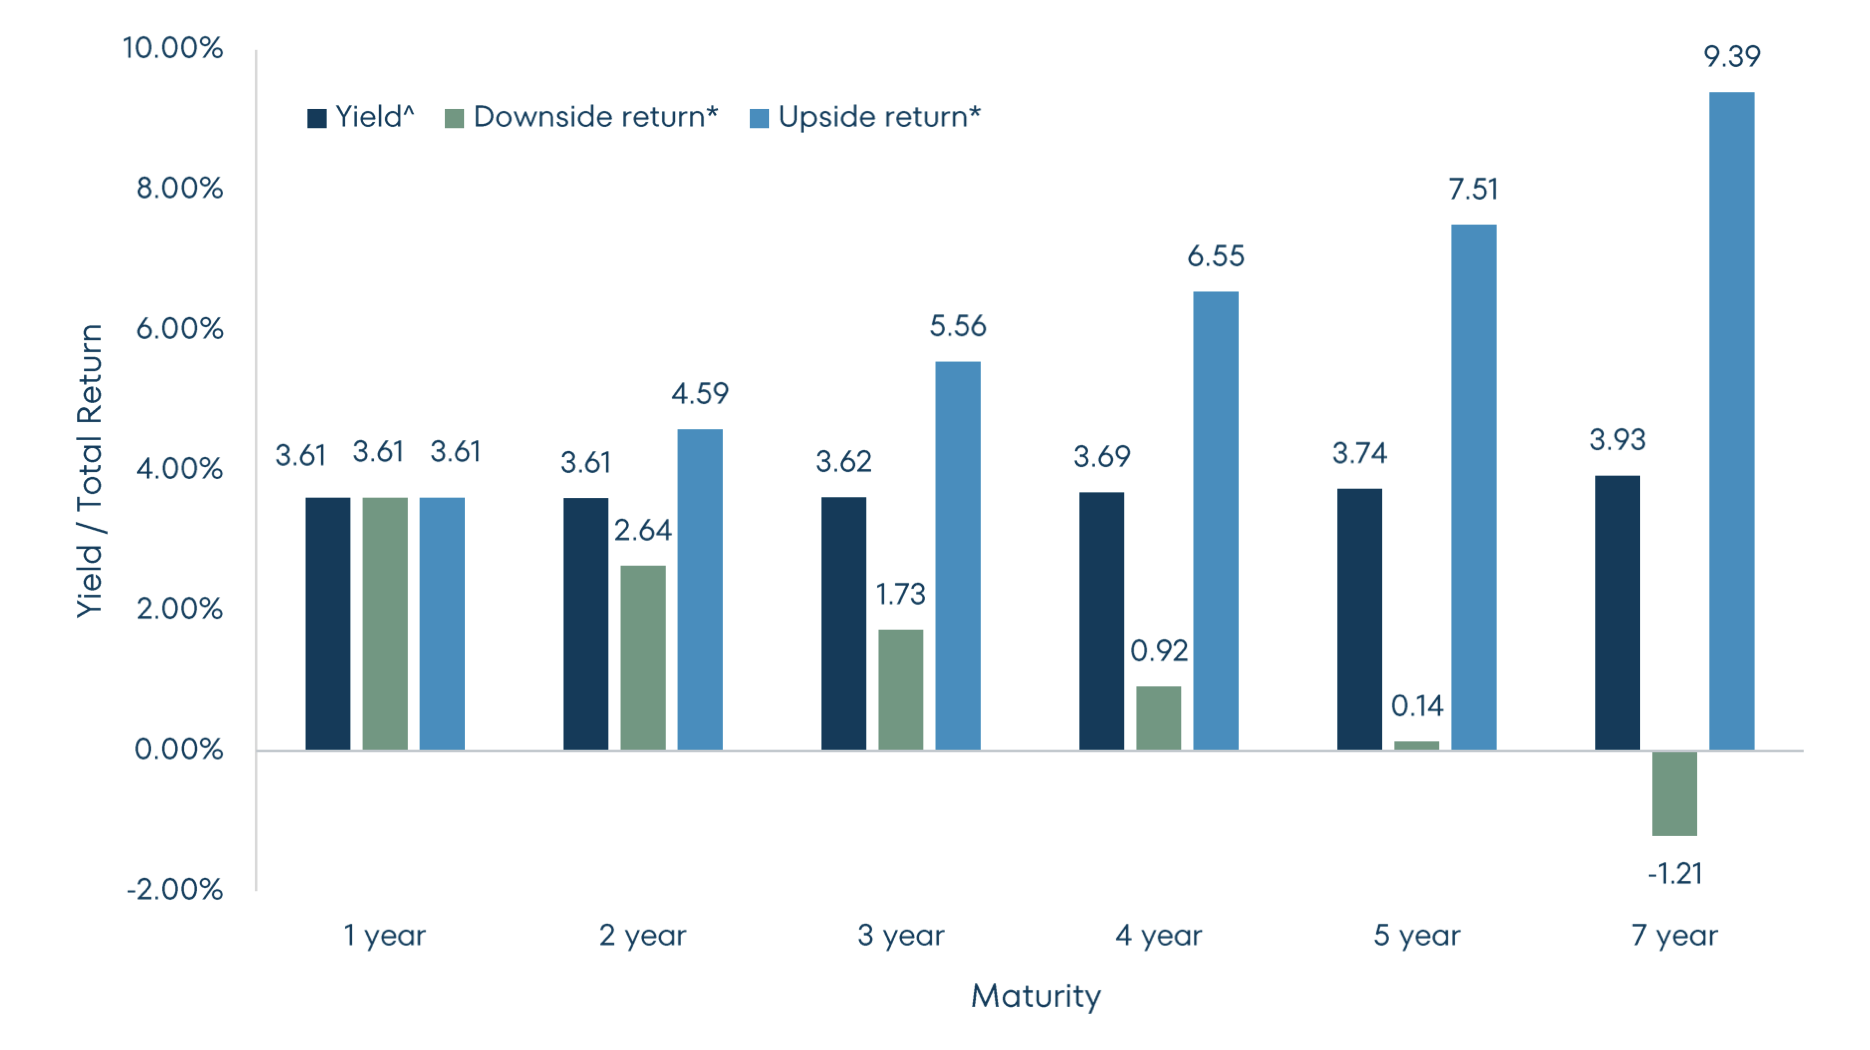
As of September 30, 2025. Source: Bloomberg. ¹ Yield-to-maturity is the annualized total return anticipated on a bond if the bond is held until it matures and assumes all payments are made as scheduled and are reinvested at the same yield. ² Downside return estimates the 12-month total return assuming yields increase by 100 bps over 12 months. Upside return estimates the 12-month total return assuming yields decline by 100 bps over 12 months. Return estimates assume gradual change in yield over 12 months. The hypothetical stress test data provided herein is for illustrative and informational purposes only and is intended to demonstrate the mathematical impact of a hypothetical change in Treasury yields on Treasury returns. No representation is being made that any account, product or strategy will or is likely to achieve profits, losses, or results similar to those shown. Hypothetical results do not reflect trading in actual accounts, and does not reflect the impact that all economic, market or other factors may have on the management of the account. Hypothetical results have certain inherent limitations. There are frequently sharp differences between simulated results and the actual results subsequently achieved by any particular account, product or strategy. Past performance is no guarantee, nor is it indicative, of future results. Please refer to the back of the commentary for important disclosures.
The dark blue bars above show Treasury yields of various maturities on September 30, 2025. The green bars show the results of our duration test and represent the potential short-term downside return for these bonds in a rising interest rate environment. For example, the 5-year Treasury purchased at a 3.74% yield was expected to return 0.14% over twelve months if its yield increased by 100 bps from 3.74% to 4.74% during that time. Because the expected short-term downside return was positive, the 5-year Treasury was a candidate for our portfolio. The 7-year Treasury was not a candidate for our portfolio at that time because it produced an expected short-term loss. During the quarter, all things being equal, we sought investments with a duration that approximated that of the 5-year Treasury.
There are a number of reasons rates might increase, but there are also a number of reasons they might decrease. The light blue bars on the chart above indicate the short-term upside return potential over twelve months if rates decreased by 100 bps. In the example above, the 5-year Treasury offered a potential 12-month total return of 7.51%.
Despite the decrease in Treasury yields over the past few months and year-to-date, yields are still at levels that were last seen over 15 years ago:
Treasury Yield
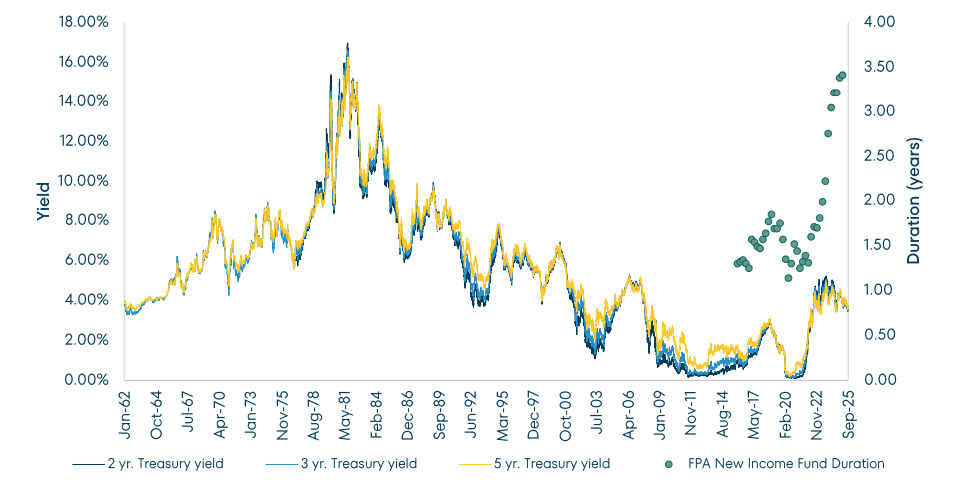
Source: Bloomberg. Data from 1/5/1962-9/30/2025. Past performance is no guarantee, nor is it indicative, of future results. Please refer to the end of the commentary for Important Disclosures and Index definitions.
We believe the longer-duration bonds identified by our duration test this quarter offer an attractive combination of some short-term downside protection⁹ against rising interest rates coupled with meaningful short-term upside potential if interest rates decline – a particularly compelling combination given the uncertainty around the future path of economic growth, inflation, and monetary policy. From another perspective, we believe these longer duration bonds offer much of the upside available in longer-duration indices like the Aggregate Bond Index with a smaller potential drawdown.
For the past several months, we have had to navigate a market with very low spreads. The chart below shows the yield and spread on the Bloomberg Aggregate Bond Index.
9 Downside protection refers strictly to a strategic investment goal and is not meant to imply any guarantee against loss, including the loss of the entire principal amount invested.
Bloomberg U.S. Aggregate Bond Index
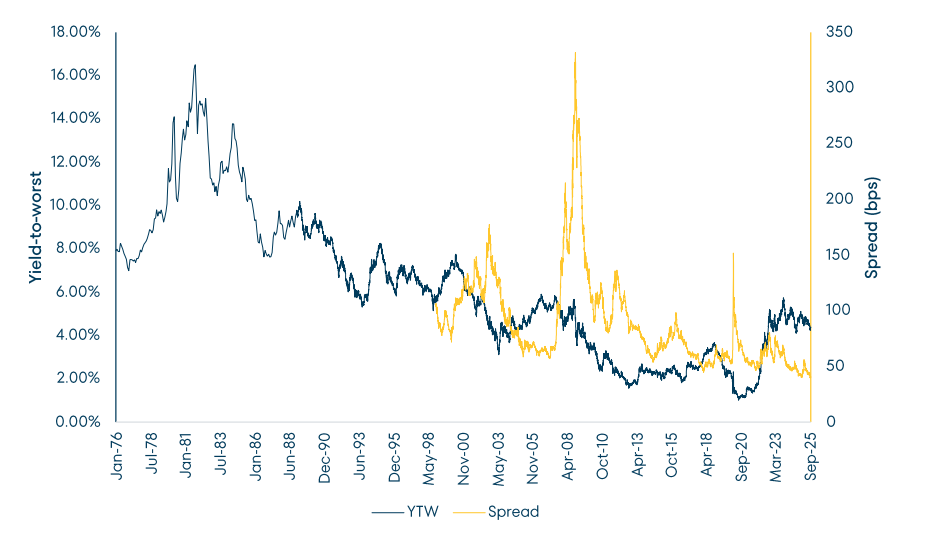
Source: Bloomberg. As of September 30, 2025. YTW is Yield-to-Worst. Spread reflects the quoted spread of a bond that is relative to the security off which it is priced, typically an on the run treasury. Past performance is no guarantee, nor is it indicative, of future results. Please refer to the end of the commentary for Important Disclosures and Index definitions.
At 41 bps on September 30, the overall spread on the Aggregate Bond Index was near all-time lows – the zero percentile in fact. (A lower percentile indicates a more expensive market.) Part of the decrease in the Bloomberg Aggregate Bond Index’s spread in recent years can be attributed to the increase in Treasury exposure within that index. However, even excluding Treasuries, spreads were very low. For example, investment grade corporate bond spreads were at 75 bps (the zero percentile) at September 30 while the index-eligible portion of the ABS, CMBS, and MBS markets were near or below the 25th percentile.
Similarly, the high yield market was historically expensive. The following chart shows the yield and spread on the Bloomberg High Yield Index and the BB component of the Bloomberg High Yield Index, excluding energy. We find the latter index to be a better directional measure of high yield prices because it removes some of the distortions caused by compositional changes in the broader index over time.
Bloomberg U.S. Corporate High Yield Index
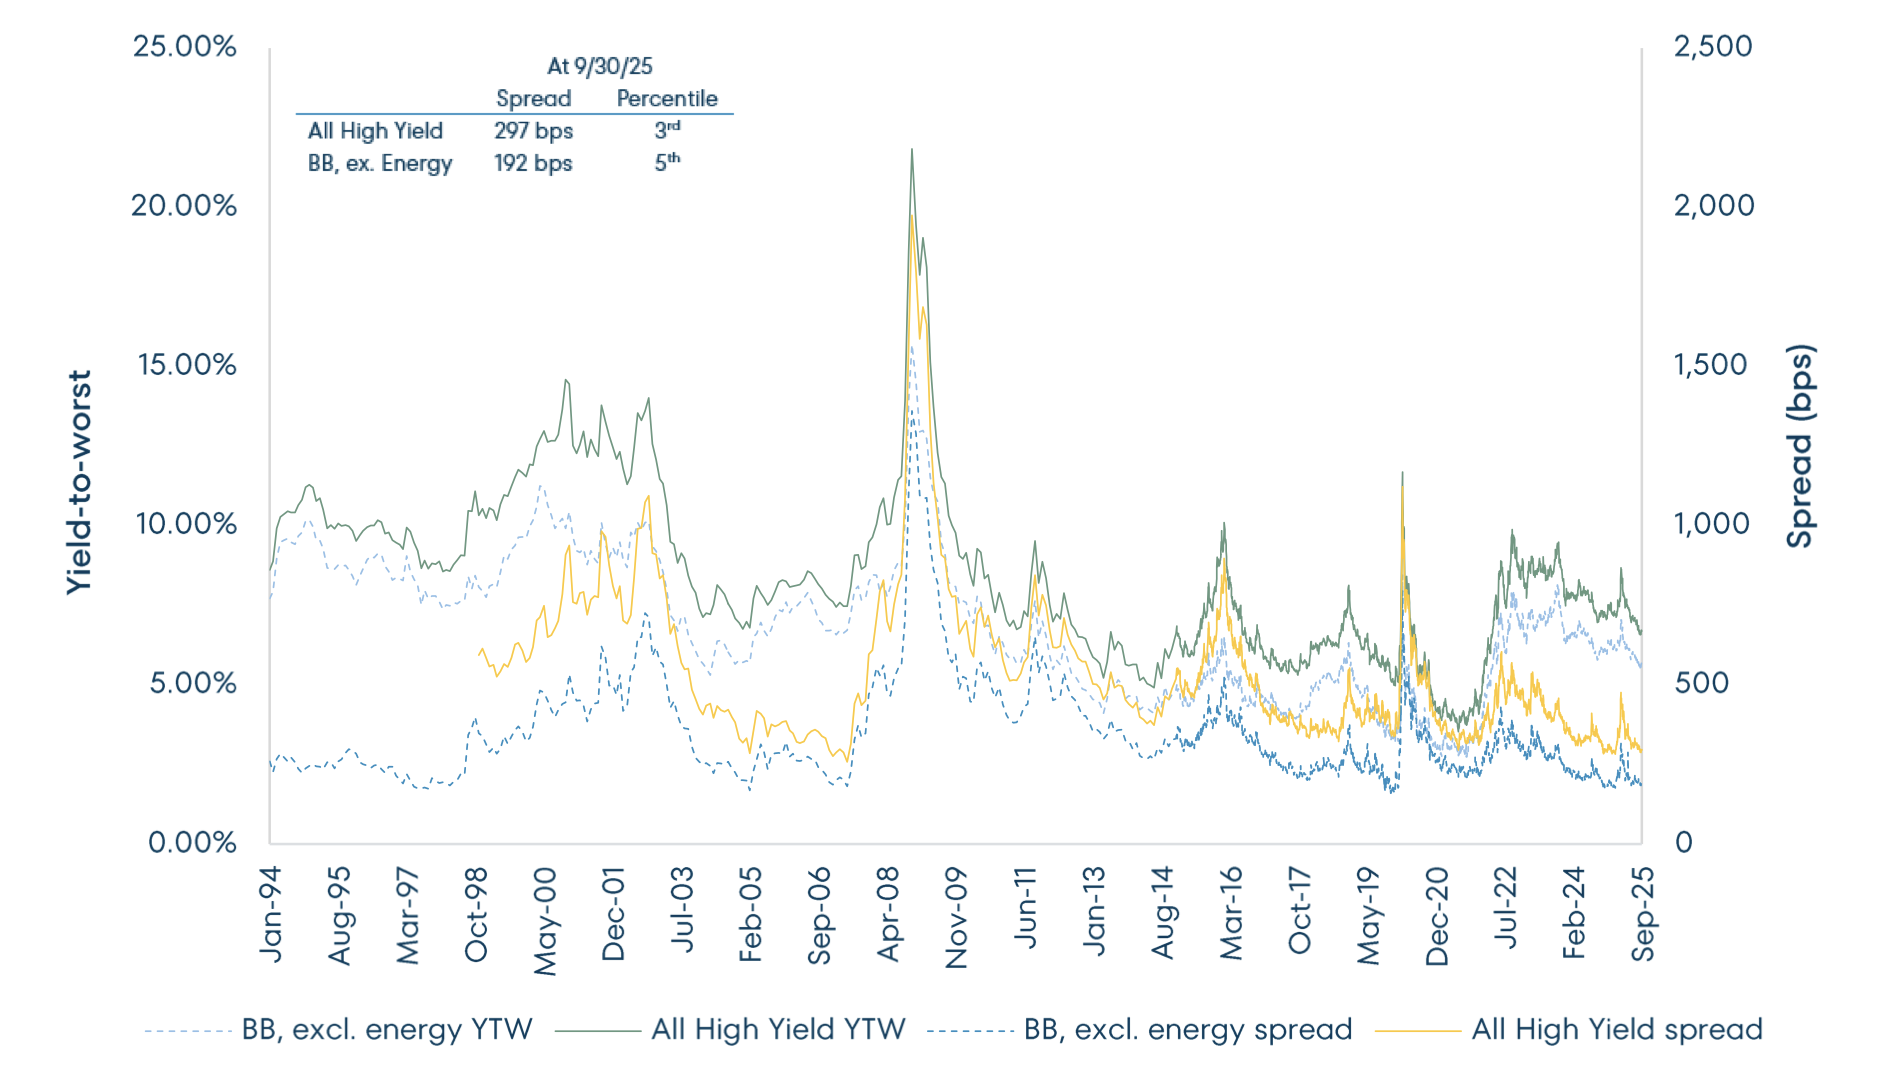
Source: Bloomberg. As of September 30, 2025. YTW is Yield-to-Worst. Spread reflects the quoted spread of a bond that is relative to the security off which it is priced, typically an on the run Treasury. Past performance is no guarantee, nor is it indicative, of future results. Please refer to the end of the commentary for Important Disclosures and Index definitions.
At 297 bps, spreads on the High Yield Index ended the quarter at the third percentile while the BB component shown above ended the quarter at 192 bps or the fifth percentile.
With spreads at such low levels, we are not surprised that our bottom-up investment process led us toward higher quality bonds. Not only do low spreads put investors at risk of uncompensated losses from credit-related impairments, but low spreads also introduce greater exposure to mark-to-market losses if and when bonds re-price to higher spreads because of idiosyncratic issues or exogenous events. We don’t know what that exogenous event might be – perhaps a recession, war, lurching government policy, credit contagion, fear of endemic fraud, or a pandemic, just to name a few possibilities. What we do know is that, historically, markets priced on the assumption of perfection tend not to do well when reality ends up being imperfect.
Further, the excess return that one can expect when buying debt at low spreads is unappealing. The chart below shows the forward one-year return on the Bloomberg High Yield Index in excess of the return on similar duration Treasuries versus the spread on that high yield index at the start of each one-year period. Historically, the average excess return has been negative when the starting spread is less than 300 bps. As noted above, the spread on the Bloomberg High Yield Index ended the quarter at 297 bps.
Bloomberg U.S. Corporate High Yield Spread vs. Forward Excess Return
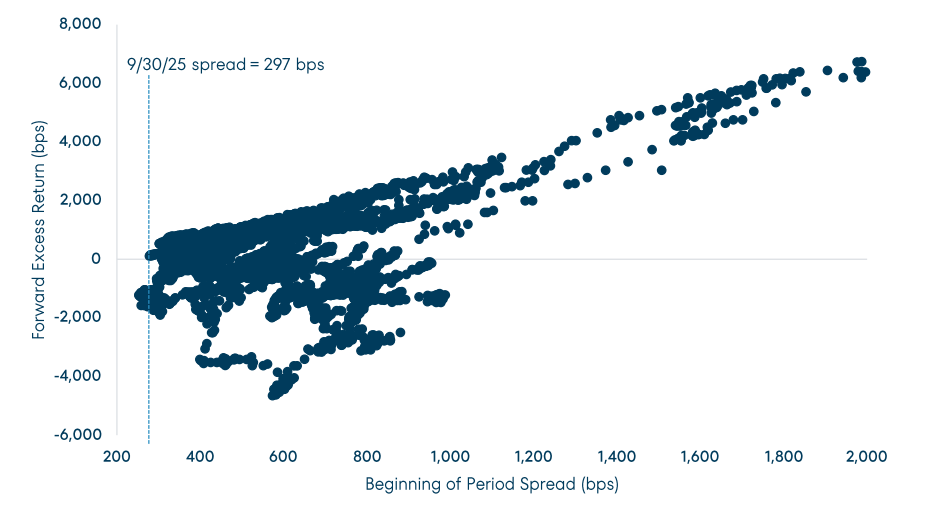
Source: Bloomberg; As of September 30, 2025. Chart covers the period 11/27/98 to 9/30/24 and shows the forward one-year return on the Bloomberg U.S. Corporate High Yield Index in excess of the return on similar duration Treasuries versus the starting spread on that high yield index at the start of each one-year period. Past performance is no guarantee, nor is it indicative, of future results.
To mitigate our exposure to the ills of low spreads, we have shied away from investments that have less sponsorship in the market and gravitated instead toward more widely accepted investments that we believe offer better liquidity in times of trouble and that we expect will increase in spread by a smaller amount than other investments might, because debt investors often flee toward familiarity in times of stress. This positioning does not represent our making a bet on some future event. Rather, we are merely responding to the current low spread environment. If spreads were higher, we might be more willing to invest elsewhere but that is not the world we live in today.
Our relatively high-quality, longer-duration positioning is out of step with many of our peers but our decades of experience have shown us that following the crowd may be a well-trodden path, but it is not a path that we believe leads to attractive long-term risk-adjusted returns.
Thank you for your confidence and continued support.
Abhijeet Patwardhan
Portfolio Manager
October 2025
Important Information
This Commentary is for informational and discussion purposes only and does not constitute, and should not be construed as, an offer or solicitation for the purchase or sale of any securities, products or services discussed, and neither does it provide investment advice. Any such offer or solicitation shall only be made pursuant to the Fund’s Prospectus, which supersedes the information contained herein in its entirety.
The views expressed herein and any forward-looking statements are as of the date of the publication and are those of the portfolio management team. Future events or results may vary significantly from those expressed and are subject to change at any time in response to changing circumstances and industry developments. This information and data has been prepared from sources believed reliable, but the accuracy and completeness of the information cannot be guaranteed and is not a complete summary or statement of all available data. You should not construe the contents of this document as legal, tax, accounting, investment or other advice or recommendations.
Abhijeet Patwardhan has been portfolio manager for the Fund since November 2015. Thomas Atteberry managed/co-managed the Fund from November 2004 through June 2022. Effective July 1, 2022, Mr. Atteberry transitioned to a Senior Advisory role. There were no material changes to the investment process due to this transition. Effective September 30, 2023, Mr. Atteberry no longer acts as a Senior Advisor to the investment team, but he remains as Senior Advisor to FPA.
Portfolio composition will change due to ongoing management of the Fund. References to individual securities or sectors are for informational purposes only and should not be construed as recommendations by the Fund, the portfolio manager, the Adviser, or the distributor. It should not be assumed that future investments will be profitable or will equal the performance of the security or sector examples discussed. The portfolio holdings as of the most recent quarter-end may be obtained at fpa.com.
The statements made herein may be forward-looking and/or based on current expectations, projections, and/or information currently available. Actual results may differ from those anticipated. The portfolio manager and/or FPA cannot assure future results and disclaims any obligation to update or alter any statistical data and/or references thereto, as well as any forward-looking statements, whether as a result of new information, future events, or otherwise. Such statements may or may not be accurate over the long-term.
Investments carry risks and investors may lose principal value. Capital markets are volatile and can decline significantly in response to adverse issuer, political, regulatory, market, or economic developments. The Fund may purchase foreign securities, including depository receipts, which are subject to interest rate, currency exchange rate, economic and political risks; these risks may be elevated when investing in emerging markets. Foreign investments, especially those of companies in emerging markets, can be riskier, less liquid, harder to value, and more volatile than investments in the United States. The securities of smaller, less well-known companies can be more volatile than those of larger companies.
The return of principal in a bond fund is not guaranteed. Bond funds have the same issuer, interest rate, inflation and credit risks that are associated with underlying bonds owned by the Fund. Lower rated bonds, convertible securities and other types of debt obligations involve greater risks than higher rated bonds.
Interest rate risk is the risk that when interest rates go up, the value of fixed income instruments, such as bonds, typically go down and investors may lose principal value. Credit risk is the risk of loss of principal due to the issuer’s failure to repay a loan. Generally, the lower the quality rating of a fixed income instrument, the greater the risk that the issuer will fail to pay interest fully and return principal in a timely manner. If an issuer defaults, the fixed income instrument may lose some or all of its value.
Mortgage securities and collateralized mortgage obligations (CMOs) are subject to prepayment risk and the risk of default on the underlying mortgages or other assets; such derivatives may increase volatility. Convertible securities are generally not investment grade and are subject to greater credit risk than higher-rated investments. High yield securities can be volatile and subject to much higher instances of default.
Collateralized debt obligations (“CDOs”), which include collateralized loan obligations (“CLOs”), collateralized bond obligations (“CBOs”), and other similarly structured securities, carry additional risks in addition to interest rate risk and default risk. This includes, but is not limited to: (i) distributions from the underlying collateral may not be adequate to make interest or other payments; (ii) the quality of the collateral may decline in value or default; and (iii) the complex structure of the security may not be fully understood at the time of investment and may produce disputes with the issuer or unexpected investment results. Investments in CDOs are also more difficult to value than other investments.
Value style investing presents the risk that the holdings or securities may never reach their full market value because the market fails to recognize what the portfolio management team considers the true business value or because the portfolio management team has misjudged those values. In addition, value style investing may fall out of favor and underperform growth or other styles of investing during given periods.
The ratings agencies that provide ratings are Standard and Poor’s (“S&P”), Fitch, Moody’s, Kroll, DBRS, and any other nationally recognized statistical rating organization (“NRSRO”). Credit ratings range from AAA (highest) to D (lowest). Bonds rated BBB or above are considered investment grade. Credit ratings of BB and below are lower-rated securities (junk bonds). High-yielding, non-investment grade bonds (junk bonds) involve higher risks than investment grade bonds. Bonds with credit ratings of CCC/Caa or below have high default risk. Please refer to the Fund’s Prospectus for a complete overview of the primary risks associated with the Fund.
The Fund is not authorized for distribution unless preceded or accompanied by a current prospectus. The prospectus can be accessed at: https://fpa.com/request-funds-literature.
Hypothetical Stress-Tested Result
The hypothetical and estimated data provided herein is for illustrative and informational purposes only. No representation is being made that Fund or the securities used for the simulation will or is likely to achieve profits, losses, or results similar to those shown. Hypothetical and estimated results do not reflect trading in actual accounts, and do not reflect the impact that economic, market or other factors may have on the management of the account.
The hypothetical and estimated results as set forth in this commentary do not represent actual results; actual results may significantly differ from the theoretical data being presented. Hypothetical/estimated results have certain inherent limitations. Hypothetical models theoretically may be changed from time to time to obtain more favorable results. There may be sharp differences between simulated or estimated results and the actual results subsequently achieved by any particular security, account, product or strategy. In addition, simulated/estimated results cannot account for the impact of certain market risks such as a lack of liquidity or default risk. There are numerous other factors related to the markets in general or the implementation of any specific strategy which cannot be fully accounted for in the preparation of simulated or estimated results, all of which can adversely affect actual results.
A client’s individual portfolio results may vary from any hypothetical or estimated results because of the timing of trades, deposits and withdrawals, the impact of management fees and taxes, market fluctuations, trading costs, cash flows, custodian fees, among other factors. Hypothetical results are not meant to be construed as a prediction of the future return of the Fund. Past performance is no guarantee, nor is it indicative, of future results.
Index Definitions
Comparison to any index is for illustrative purposes only and should not be relied upon as a fully accurate measure of comparison. The Fund will be less diversified than the indices noted herein and may hold non-index securities or securities that are not comparable to those contained in an index. Indices will hold positions that are not within the Fund’s investment strategy. Indices are unmanaged, do not reflect any commissions, fees or expenses which would be incurred by an investor purchasing the underlying securities. The Fund does not include outperformance of any index or benchmark in its investment objectives. Investors cannot invest directly in an index
Bloomberg U.S. Aggregate Bond Index provides a measure of the performance of the U.S. investment grade bonds market, which includes investment grade U.S. Government bonds, investment grade corporate bonds, mortgage pass-through securities and asset-backed securities that are publicly offered for sale in the United States. The securities in the Index must have at least 1 year remaining in maturity. In addition, the securities must be denominated in U.S. dollars and must be fixed rate, nonconvertible, and taxable.
Bloomberg U.S. Aggregate 1-3 Year Bond Index provides a measure of the performance of the U.S. investment grade bonds market, which includes investment grade U.S. Government bonds, investment grade corporate bonds, mortgage pass-through securities and asset-backed securities that are publicly offered for sale in the United States. The securities in the Index must have a remaining maturity of 1 to 3 years. In addition, the securities must be denominated in U.S. dollars and must be fixed rate, nonconvertible, and taxable.
Bloomberg U.S. Corporate High Yield Bond Index measures the market of USD-denominated, non-investment grade, fixed-rate, taxable corporate bonds.
Bloomberg U.S. Investment Grade Corporate Index measures the investment grade, fixed-rate, taxable corporate bond market. It includes USD denominated securities publicly issued by US and non-US industrial, utility, and financial issuers.
Consumer Price Index (CPI) is an unmanaged index representing the rate of the inflation of the U.S. consumer prices as determined by the U.S. Department of Labor Statistics. This index reflects non-seasonally adjusted returns. There can be no guarantee that the CPI or other indexes will reflect the exact level of inflation at any given time.
CPI +100 Basis Points is created by adding 1% to the annual percentage change in the Consumer Price Index (“CPI”).
Merrill Lynch Option Volatility Estimate (MOVE) Index reflects the level of volatility in U.S. Treasury futures. The index is considered a proxy for term premiums of U.S. Treasury bonds (i.e., the yield spread between long-term and short-term bonds).
Morningstar Short-Term Bond portfolios invest primarily in corporate and other investment-grade U.S. fixed-income issues and typically have durations of 1.0 to 3.5 years. These portfolios are attractive to fairly conservative investors, because they are less sensitive to interest rates than portfolios with longer durations. Morningstar calculates monthly breakpoints using the effective duration of the Morningstar Core Bond Index in determining duration assignment. Short-term is defined as 25% to 75% of the three-year average effective duration of the MCBI. As of June 30, 2025, there were 561 funds in the category.
Glossary of Terms
ABS (Asset Backed Securities) are financial securities backed by a loan, lease or receivables against assets other than real estate and mortgage-backed securities.
Basis Point (bps) is equal to one hundredth of one percent, or 0.01%. 100 basis points = 1%.
A bond premium occurs when the price of the bond has increased in the secondary market. A bond might trade at a premium because its interest rate is higher than current rates in the market
CLO (Collateralized Loan Obligation) is a single security backed by a pool of debt.
CMBS (Commercial Mortgage-Backed Security) is a mortgage-backed security backed by commercial mortgages rather than residential mortgages
Core duration bonds (also known as core bonds) refer to bonds similar in duration to Bloomberg U.S. Aggregate Bond Index
Coupon is the interest rate stated on a bond when it’s issued. The coupon is typically paid semiannually
Corporate Holdings include bank debt, corporate bonds and common stock.
Effective Duration is the duration calculation for bonds with embedded options. Effective duration takes into account that expected cash flows will fluctuate as interest rates change.
Mark-to-market is a method of recording the price or value of a security portfolio, or account to reflect the current market value rather than book value.
RMBS (Residential Mortgage-Backed Securities) are mortgage-backed securities backed by residential mortgages.
Stripped Mortgage-Backed Securities is a trust comprised of mortgage-backed securities which are split into principal-only strips and interest-only strips.
Weighted Average Life (WAL) is the average length of time that each dollar of unpaid principal on a loan, a mortgage, or an amortizing bond remains outstanding. The time weightings used in WAL calculations are based on payments to the principal (and exclude payments to interest). WAL shows an investor how many years it will take to receive roughly half the amount of outstanding principal. A lower WAL may suggest the bond carries less credit risk.
Yield to Maturity (YTM) is the total return anticipated on a bond if the bond is held until it matures.
©2025 Morningstar, Inc. All Rights Reserved. The information contained herein: (1) is proprietary to Morningstar and/or its content providers; (2) may not be copied or distributed; and (3) is not warranted by Morningstar to be accurate, complete or timely. Neither Morningstar nor its content providers are responsible for any damages or losses arising from any use of this information. Past performance is no guarantee of future results.
The FPA Funds are distributed by Distribution Services, LLC. 190 Middle Street, Suite 301, Portland, ME 04101. Distribution Services, LLC and FPA are not affiliated.