
There are two main risk premiums required by bond investors: interest rate risk and credit risk. In an ideal world, both risk premiums would be high. Today one is high, but the other is definitely not.
We can measure the risk premium offered by taking interest rate risk simply by looking at the real yield in Treasury Inflation Protected Securities (TIPS). When real yields are positive and high, it is great to be a bond investor and one is paid to take on duration risk. When real yields are low or negative, if you are a lender, you should take on less than normal duration risk.
We can measure the risk premium offered by taking credit risk by looking at high-yield spreads (the extra yield one gets over Treasuries by lending to risky companies).
The chart below plots 10-year TIPS yields on the X axis and high yield spreads on the Y axis:
TIPS 10-Year vs High Yield Bond Spreads (January 2003 to February 2025)
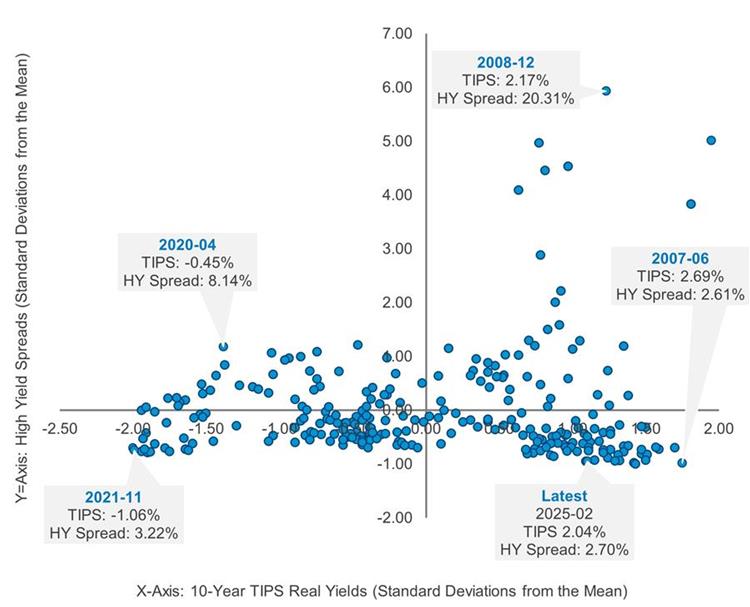
Source: Federal Reserve Economic Data. Market Yield on U.S. Treasury Securities at 10-Year Constant Maturity, Quoted on an Investment Basis, Inflation-Indexed, Percent, Monthly, Not Seasonally Adjusted. ICE BofA BBB US Corporate Index Option-Adjusted Spread, Percent, Monthly, Not Seasonally Adjusted. Standard Deviation is a measure of dispersion of portfolio’s return relative to its mean and is calculated as the square root of the variance.
The best investment environment is the top right corner (high real yields and high credit spreads). In late 2008 bond investors could make money by taking on duration risk or credit risk or ideally both!
The worst place to be is the bottom left corner (negative real yields and low credit spreads). In late 2021, bond investors were faced with the worst prospective bond investment conditions in over two decades! They needed to steer clear of both duration and credit risk rather than reach for yield.
More selective investment environments take up the last two quadrants.
In the top left, credit is cheap, but interest rate risk isn’t. Early 2020 (COVID) is the most extreme example of that situation. Last, but not least, in the bottom right quadrant is when interest rate risk is attractive, but credit risk isn’t. The months before the financial crisis (2007) is the most extreme example of this but we are not far from those conditions today (similar high yield spreads and slightly lower real yields).
1- and 3-Year Performance Following Extreme Periods of Interest Rate Risk and/or Credit Risk (January 2003 to February 2025)
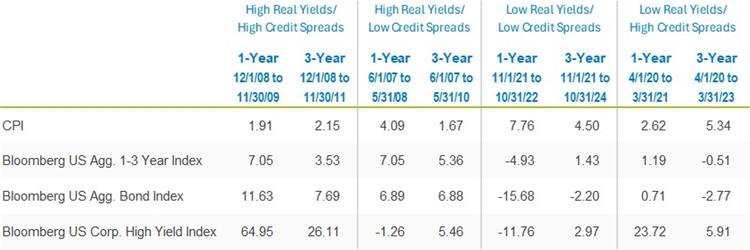
Source: Morningstar. Past performance is no guarantee, nor is it indicative, of future results.
We believe fixed investors should embrace duration (flashing green) but be wary of credit risk (flashing red). Though it was our absolute value perspective that led us to that conclusion and resulted in our increasing duration and reducing credit risk in both FPA New Income and FPA Flexible Fixed Income over the past several quarters, as it happens, the historical data above supports our positioning.
While this positioning may seem intuitive, it differs significantly from our peers who, on average, are taking on less interest rate risk and considerably more credit risk (using FPA New Income as an example):
Effective Duration: FPA New Income Fund and Morningstar Short-term Bond Portfolio Category Average
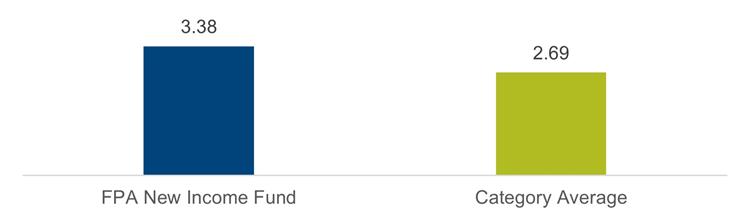
Source: Bloomberg. As of December 31, 2024. The Bloomberg Family of Indices ratings rules use the median if more than two ratings are available. Lower of the two is used if only two ratings are available.
Important Disclosures
This communication is for informational and discussion purposes only and does not constitute, and should not be construed as, a recommendation, financial promotions, investment advice, encouragement or an offer or solicitation for the purchase or sale with respect to any securities, products, or services discussed, and neither does it provide investment advice. Any such offer or solicitation shall only be made pursuant to the relevant offering documents for an FPA Fund or other client account, which supersedes the information contained herein in its entirety. This communication does not constitute an investment management agreement or offering circular. The information and data presented has been prepared from sources believed reliable, but the accuracy and completeness of the information cannot be guaranteed and is not a complete summary or statement of all available data. You should not construe the contents of this communication as legal, tax, investment or other advice or recommendations.
You should consider the FPA New Income Fund and Flexible Fixed Income Fund (each a “Fund”, and collectively the “Funds”) investment objectives, risks, and charges and expenses carefully before you invest. The Prospectus for each Fund details each Fund’s objective and policies, charges, and other matters of interest to the prospective investor. Please read the relevant Fund’s Prospectus carefully before investing. The Prospectus for each Fund may be obtained by visiting the website at fpa.com, by email at [email protected], toll-free by calling 1-800-982-4372 or by contacting each Fund in writing.
Any Fund data included herein represents past performance and investors should understand that investment returns and principal values fluctuate, so that when you redeem your investment it may be worth more or less than its original cost. As with any investment, there is always the potential for gain, as well as the possibility of loss. Past performance is no guarantee of future results and current performance may be higher or lower than the performance shown. Current month-end performance data for each Fund, which may be lower or higher than the performance data quoted, may be obtained at fpa.com or by calling toll-free, 1-800-982-4372.
Abhijeet Patwardhan has been portfolio manager for the FPA New Income Fund since November 2015 and for FPA Flexible Fixed Income Fund since its inception in December 2018. Thomas Atteberry managed/co-managed FPA New Income Fund from November 2004 through June 2022 and co-managed FPA Flexible Fixed Income Fund since its inception through June 2022. Effective July 1, 2022, Mr. Atteberry transitioned to a Senior Advisory role. There were no material changes to the investment process due to this transition. Effective September 30, 2023, Mr. Atteberry no longer acts as Senior Advisor to the Funds, but he remains as Senior Advisor to FPA.
The information contained herein reflects certain opinions and/or views as of the date provided, is subject to change without notice, and may be forward-looking and/or based on current expectations, projections, and/or information currently available. Such information may not be accurate over the long term. Actual results may differ from those anticipated. These opinions/views may differ across the portfolio managers and analysts of the firm as a whole and are not intended to be a forecast of future events, a guarantee of future results, or investment advice. FPA cannot assure future results and disclaims any obligation to update or alter any statistical data and/or references thereto, as well as any forward-looking statements, whether as a result of new information, future events, or otherwise. Future events or results may vary significantly from those expressed and are subject to change at any time in response to changing circumstances and industry developments.
Investments, carry risks and investors may lose principal value. Capital markets are volatile and can decline significantly in response to adverse issuer, political, regulatory, market, or economic developments. FPA Funds and client accounts may purchase foreign securities, which are subject to interest rate, currency exchange rate, economic and political risks. The securities of smaller, less well-known companies can be more volatile than those of larger companies.
The return of principal in a bond fund or account is not guaranteed. Bond funds or accounts have the same issuer, interest rate, inflation, and credit risks that are associated with underlying bonds owned by the fund. Lower-rated bonds, convertible securities, and other types of debt obligations involve greater risks than higher-rated bonds.
Interest rate risk is when interest rates go up, the value of fixed income securities, such as bonds, typically go down and investors may lose principal value. Credit risk is the risk of loss of principal due to the issuer’s failure to repay a loan. Generally, the lower the quality rating of a security, the greater the risk that the issuer will fail to pay interest fully and return the principal in a timely manner. If an issuer defaults the security may lose some or all of its value. Convertible securities are generally not investment grade and are subject to greater credit risk than higher-rated investments. High-yield securities can be volatile and subject to much higher instances of default. High yield securities, senior loans, private placements, or restricted securities may carry liquidity risks.
The rating agencies that provide ratings are Standard and Poor’s, Moody’s, Fitch, DBRS, Kroll, and any other Nationally Recognized Statistical Ratings Organization (NRSRO). Credit ratings range from AAA (highest) to D (lowest). Bonds rated BBB or above are considered investment grade. Credit ratings BB and below are lower-rated securities (junk bonds). High-yielding, non-investment-grade bonds (junk bonds) involve higher risks than investment-grade bonds. Bonds with credit ratings of CCC or below have high default risk.
Value style investing presents the risk that the holdings or securities may never reach their full market value because the market fails to recognize what the portfolio management team considers the true business value or because the portfolio management team has misjudged those values. In addition, value style investing may fall out of favor and underperform growth or other styles of investing during given periods.
Portfolio composition will change due to active management. References to individual securities or sectors are for informational purposes only and should not be construed as recommendations by the Strategies/Funds, FPA, the portfolio managers, or the distributor (as applicable). The portfolio holdings as of the most recent quarter-end may be obtained at fpa.com.
A client’s individual portfolio results may vary from any hypothetical or estimated results because of the timing of trades, deposits and withdrawals, the impact of management fees and taxes, market fluctuations, trading costs, cash flows, custodian fees, among other factors. Hypothetical results are not meant to be construed as a prediction of the future return of the Fund. Past performance is no guarantee, nor is it indicative, of future results.
Please refer to the relevant Fund’s Prospectus for a complete overview of the primary risks associated with each Fund.
Glossary of Terms
Duration is a measure of the sensitivity of the price (the value of principal) of a fixed-income investment to a change in interest rates.
Effective Duration: the duration calculation for bonds with embedded options. Effective duration takes into account that expected cash flows will fluctuate as interest rates change.
Index Definitions
Comparison to any index is for illustrative purposes only and should not be relied upon as a fully accurate measure of comparison. The Strategies/Funds will be less diversified than the indices noted herein and may hold non-index securities or securities that are not comparable to those contained in an index. Indices will hold positions that are not within each Strategy’s/Fund’s investment strategy. Indices are unmanaged, do not reflect any commissions, fees, or expenses which would be incurred by an investor purchasing the underlying securities. The Strategies/Funds noted herein do not include outperformance of any index or benchmark in its investment objectives. Investors cannot invest directly in an index.
Consumer Price Index (CPI) is an unmanaged index representing the rate of the inflation of the U.S. consumer prices as determined by the U.S. Department of Labor Statistics. This index reflects non-seasonally adjusted returns. There can be no guarantee that the CPI or other indices will reflect the exact level of inflation at any given time.
Bloomberg U.S. Aggregate 1-3 Year Bond Index provides a measure of the performance of the U.S. investment grade bonds market, which includes investment grade U.S. Government bonds, investment grade corporate bonds, mortgage pass-through securities and asset-backed securities that are publicly offered for sale in the United States. The securities in the Index must have a remaining maturity of 1 to 3 years. In addition, the securities must be denominated in U.S. dollars and must be fixed rate, nonconvertible, and taxable.
Bloomberg U.S. Aggregate Bond Index provides a measure of the performance of the U.S. investment grade bonds market, which includes investment grade U.S. Government bonds, investment grade corporate bonds, mortgage pass-through securities and asset-backed securities that are publicly offered for sale in the United States. The securities in the Index must have at least 1 year remaining in maturity. In addition, the securities must be denominated in U.S. dollars and must be fixed rate, nonconvertible, and taxable.
Bloomberg U.S. Corporate High Yield Bond Index measures the market of USD-denominated, non-investment grade, fixed-rate, taxable corporate bonds.
Morningstar Short-term Bond portfolios invest primarily in corporate and other investment-grade U.S. fixed-income issues and typically have durations of 1.0 to 3.5 years. These portfolios are attractive to fairly conservative investors, because they are less sensitive to interest rates than portfolios with longer durations. Morningstar calculates monthly breakpoints using the effective duration of the Morningstar Core Bond Index in determining duration assignment. Short-term is defined as 25% to 75% of the three-year average effective duration of the MCBI. As of December 31, 2024, there were 563 funds in this category.
Past performance is no guarantee, nor is it indicative, of future results.
The FPA Funds are distributed by Distribution Services, LLC. Three Canal Plaza, Suite 100, Portland, ME 04101. Distribution Services, LLC and FPA are not affiliated.